

AECOM (ACM) provides professional infrastructure consulting services in three segments: Americas; International; and AECOM Capital. The company reported that it is on track to exceed operational expectations of its fiscal 2024 financial targets.
The company also raised its fiscal 2023 financial guidance. ACM increased its adjusted EBITDA guidance from $935 million-$975 million to $950 million-$970 million and raised its adjusted EPS guidance from $3.55-$3.75 to $3.63-$3.73. For the fiscal third quarter (ended June 30), ACM’s revenue increased 13% year-over-year to $3.66 billion.
Given this scenario, let’s look at ACM’s key financial metrics trends to see why it could be beneficial to watch the stock before it reports its fourth quarter and fiscal 2023 results on November 13.
Analyzing AECOM's Financial Performance: Fluctuations in Key Metrics from 2020 to 2023
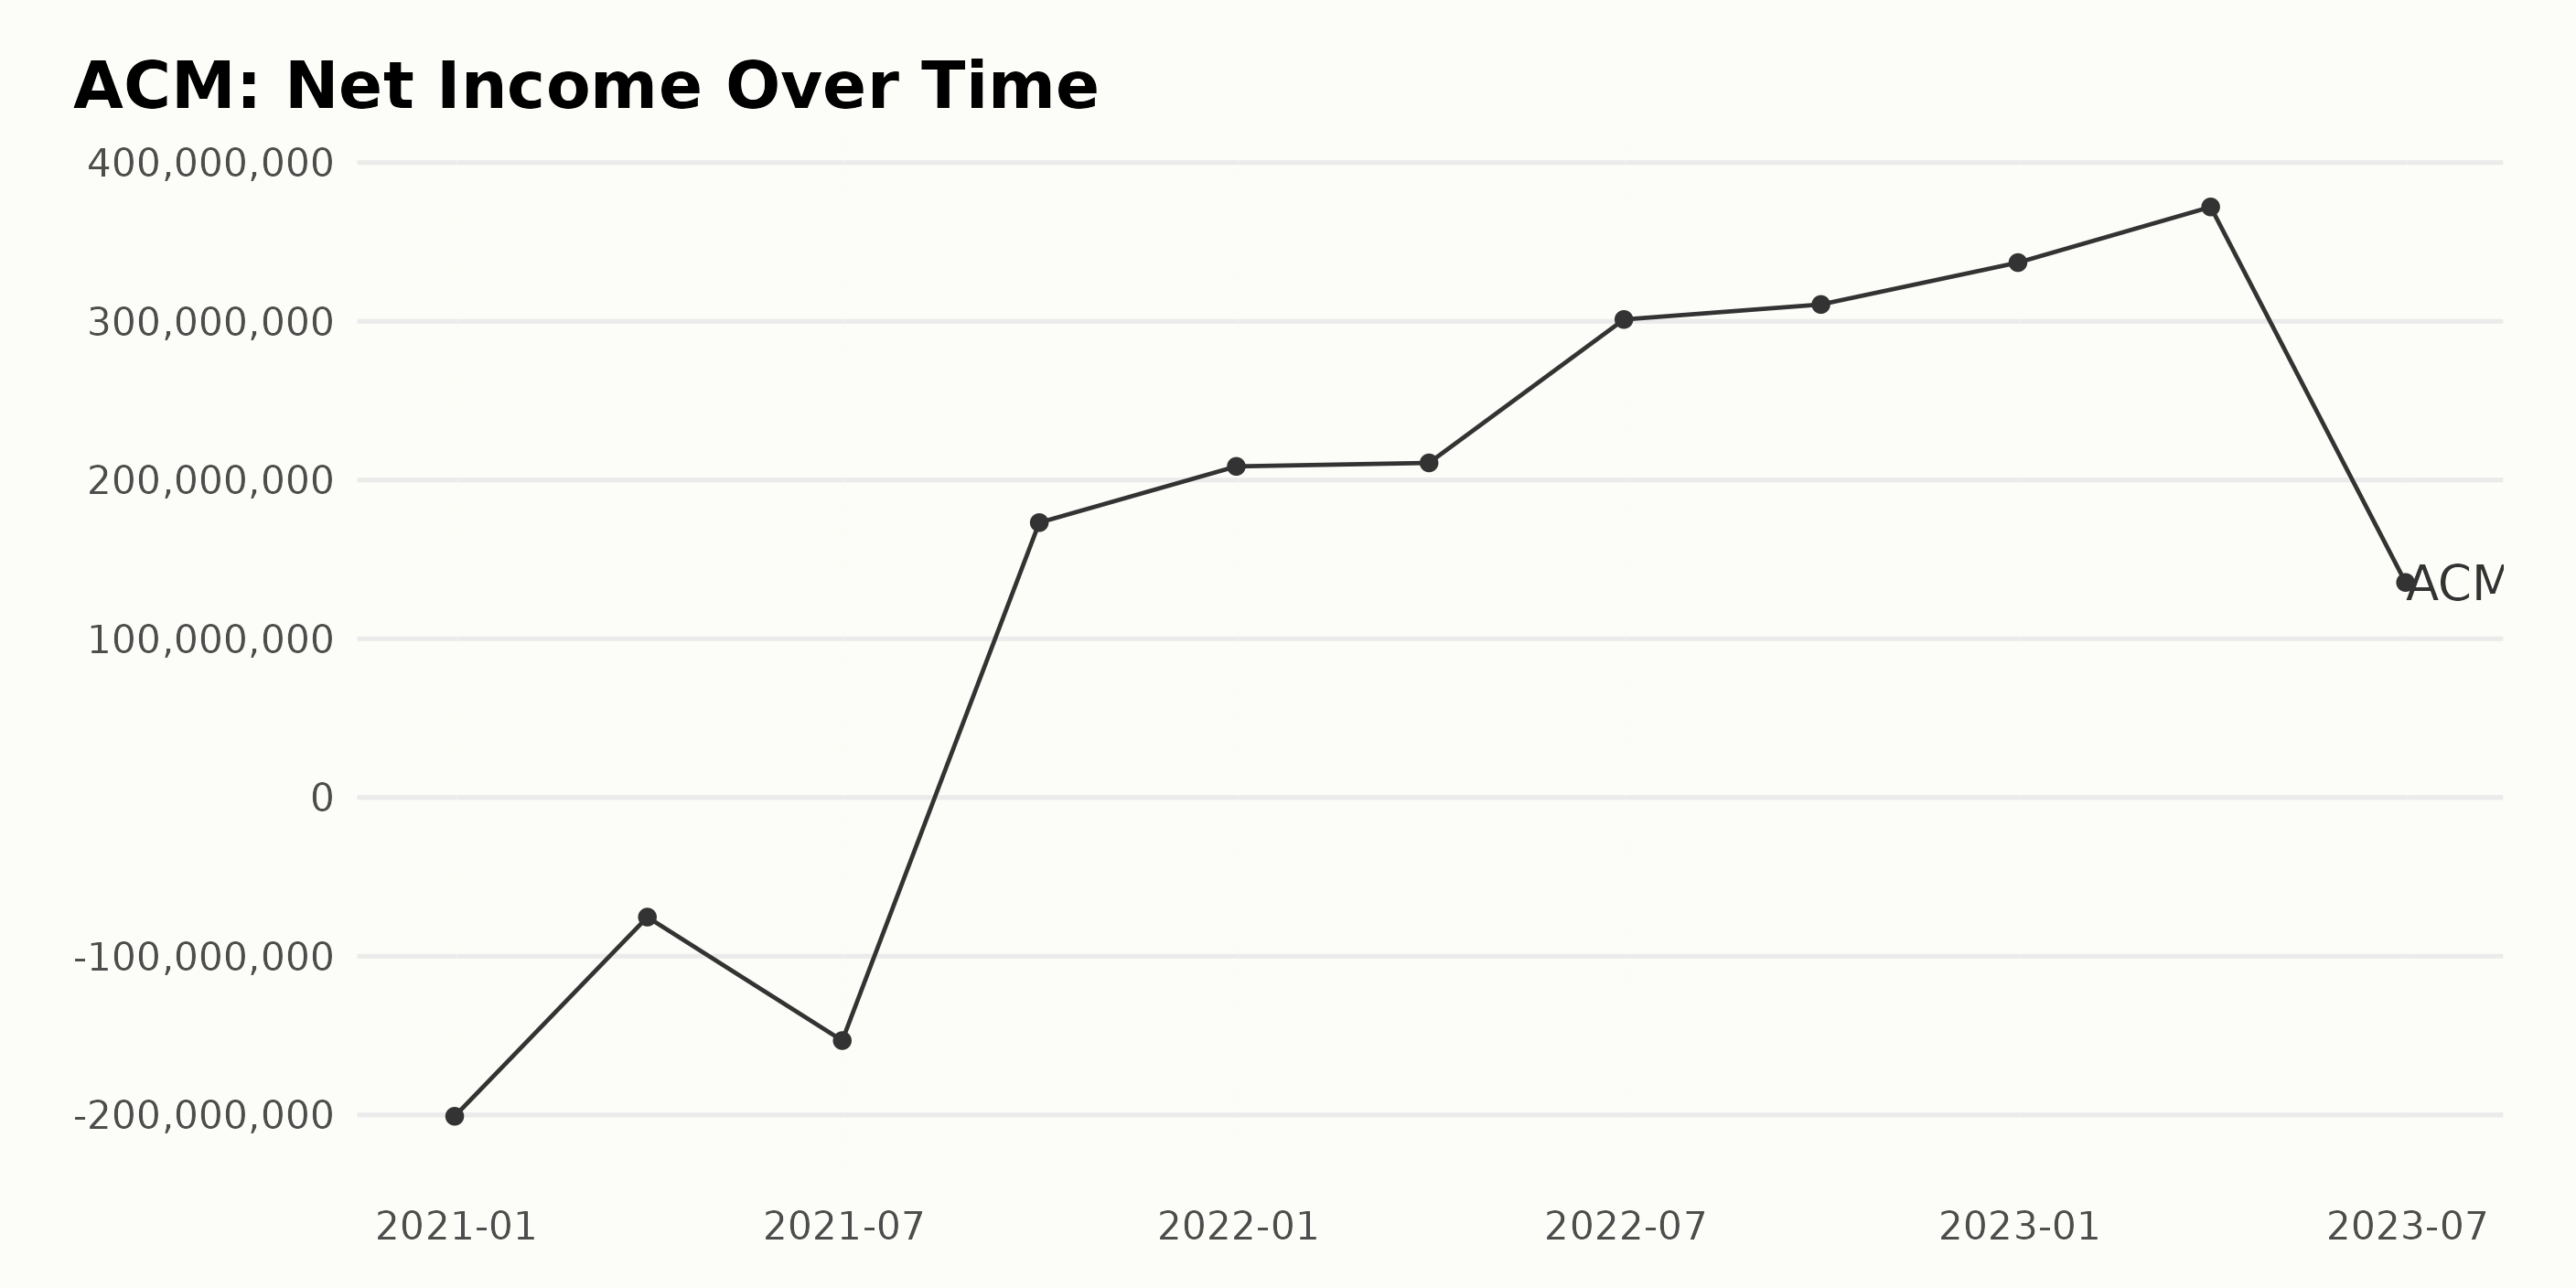
The trend of ACM's trailing-12-month net income has seen some significant fluctuations over the given period:
- On December 31, 2020, the company reported a loss of $200.85 million.
- There was a smaller loss of $75.36 million reported on March 31, 2021.
- A larger loss of $153.17 million was reported on June 30, 2021.
- The company moved into profitability with a net income of $173.19 million on September 30, 2021.
- This profitability trend continued, albeit gradually, with incomes reported for subsequent quarters: $208.61 million in December 2021, $210.80 million in March 2022, and $301.16 million in June 2022.
- By September 2022, the net income had grown to $310.61 million.
- By the end of 2022, the company reported a net income of $337.01 million.
- The growth maintained momentum until the first quarter of 2023, when net income peaked at $372.07 million on March 31, 2023.
- Lastly, a significant drop in net income was observed, with it falling to $135.48 million in June 2023.
Given this data, it appears that the most recent trends indicate growing profitability for ACM despite a drastic drop in the net income in the last report on June 30, 2023. Calculating the growth rate from the negative starting value would be misleading.
Hence, it is more meaningful to calculate the growth from the first positive net income value. The growth rate from the third quarter of 2021 ($173.19 million) to the highest point in the first quarter ($372.07 million) could be calculated as approximately 114.78%.
However, there remains significant volatility, demonstrated by the sudden drop in net income observed in June 2023.
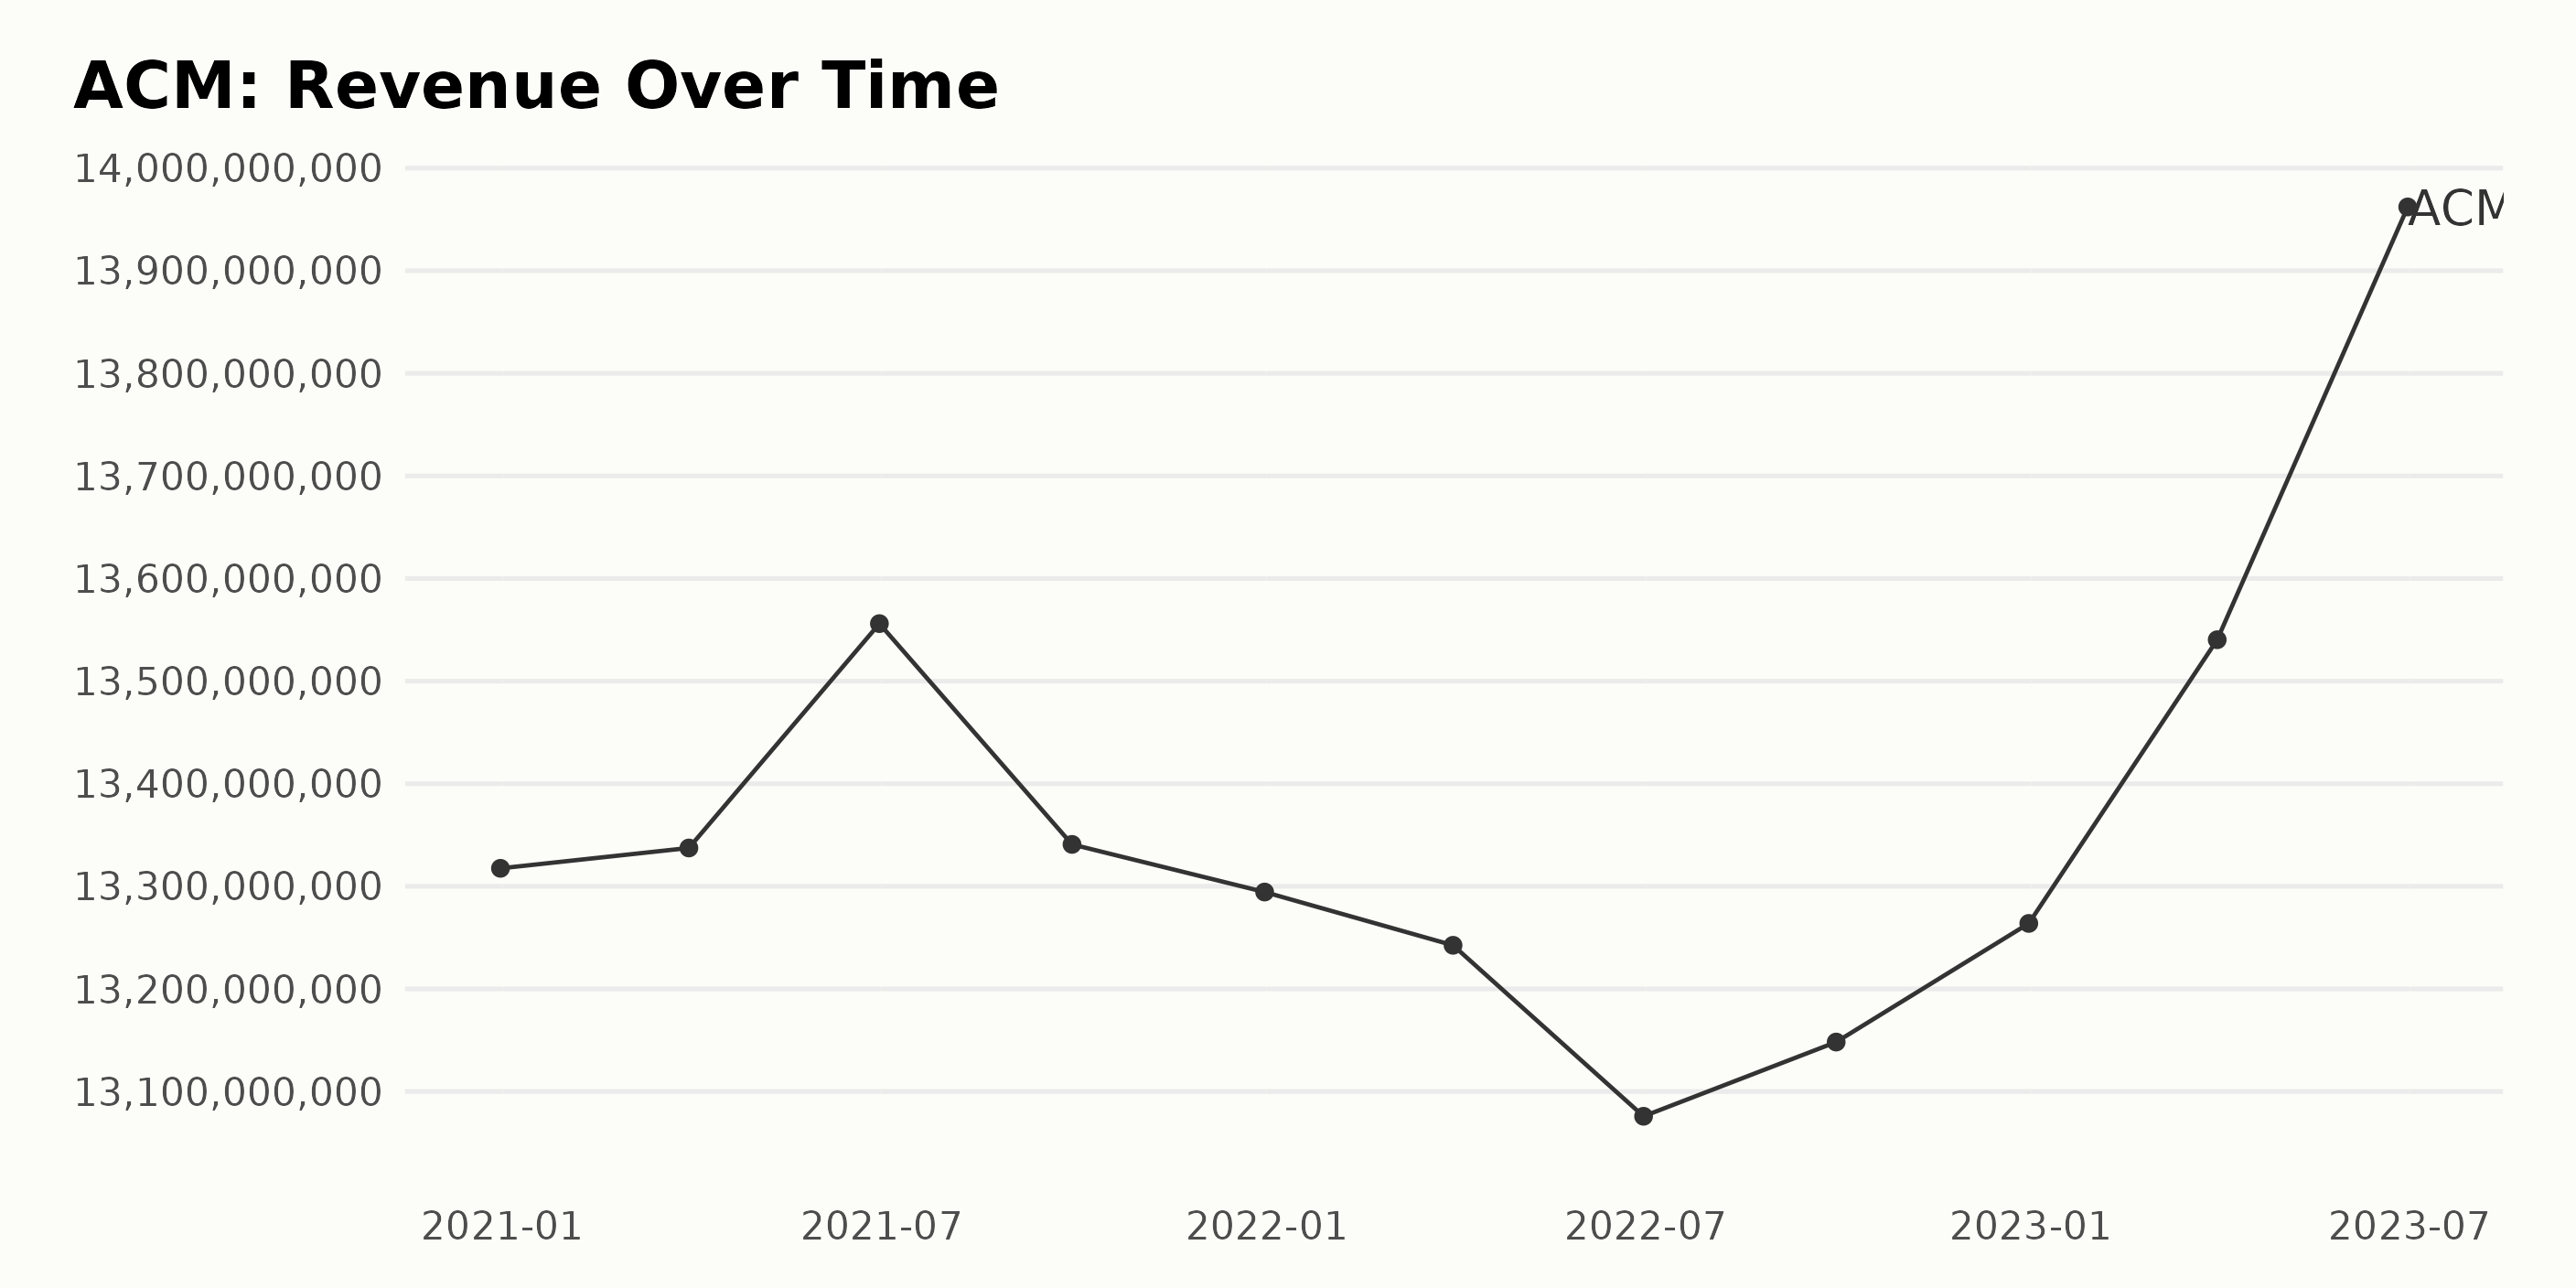
The trailing-12-month revenue trends of ACM over the observed period can be summarized as follows:
- On December 31, 2020, the revenue was at $13.32 billion.
- The first quarter of the year 2021 showed minor growth, with a recorded revenue on March 31, 2021, of $13.34 billion, which then rose to $13.56 billion by the end of the second quarter.
- However, there was a slight dip in the third quarter, falling to $13.34 billion by September 30, 2021. This trend continued till the end of the year, with December 31, 2021, recording a revenue of $13.29 billion.
- The start of 2022 saw a continued downward trend in revenue, reaching $13.24 billion on March 31 and further declining to $13.08 billion on June 30.
- There was a modest recovery in the third quarter, as the revenue increased to $13.15 billion by September 30, 2022. This trend persisted until the year's end, with December 31, 2022, reporting a revenue figure of $13.26 billion.
- The first two quarters of 2023 showed more pronounced growth, with revenue climbing to $13.54 billion by March 31 and an encouraging jump to $13.96 billion by June 30.
Overall, the revenue reflects a general downward trend from the start of 2021 to mid-2022, followed by recovery towards the end of 2022 and the initiation of a promising growth trajectory in 2023. Comparing the initial recorded value (December 31, 2020) with the latest (June 30, 2023), ACM’s revenue shows a growth rate of approximately 4.8%.
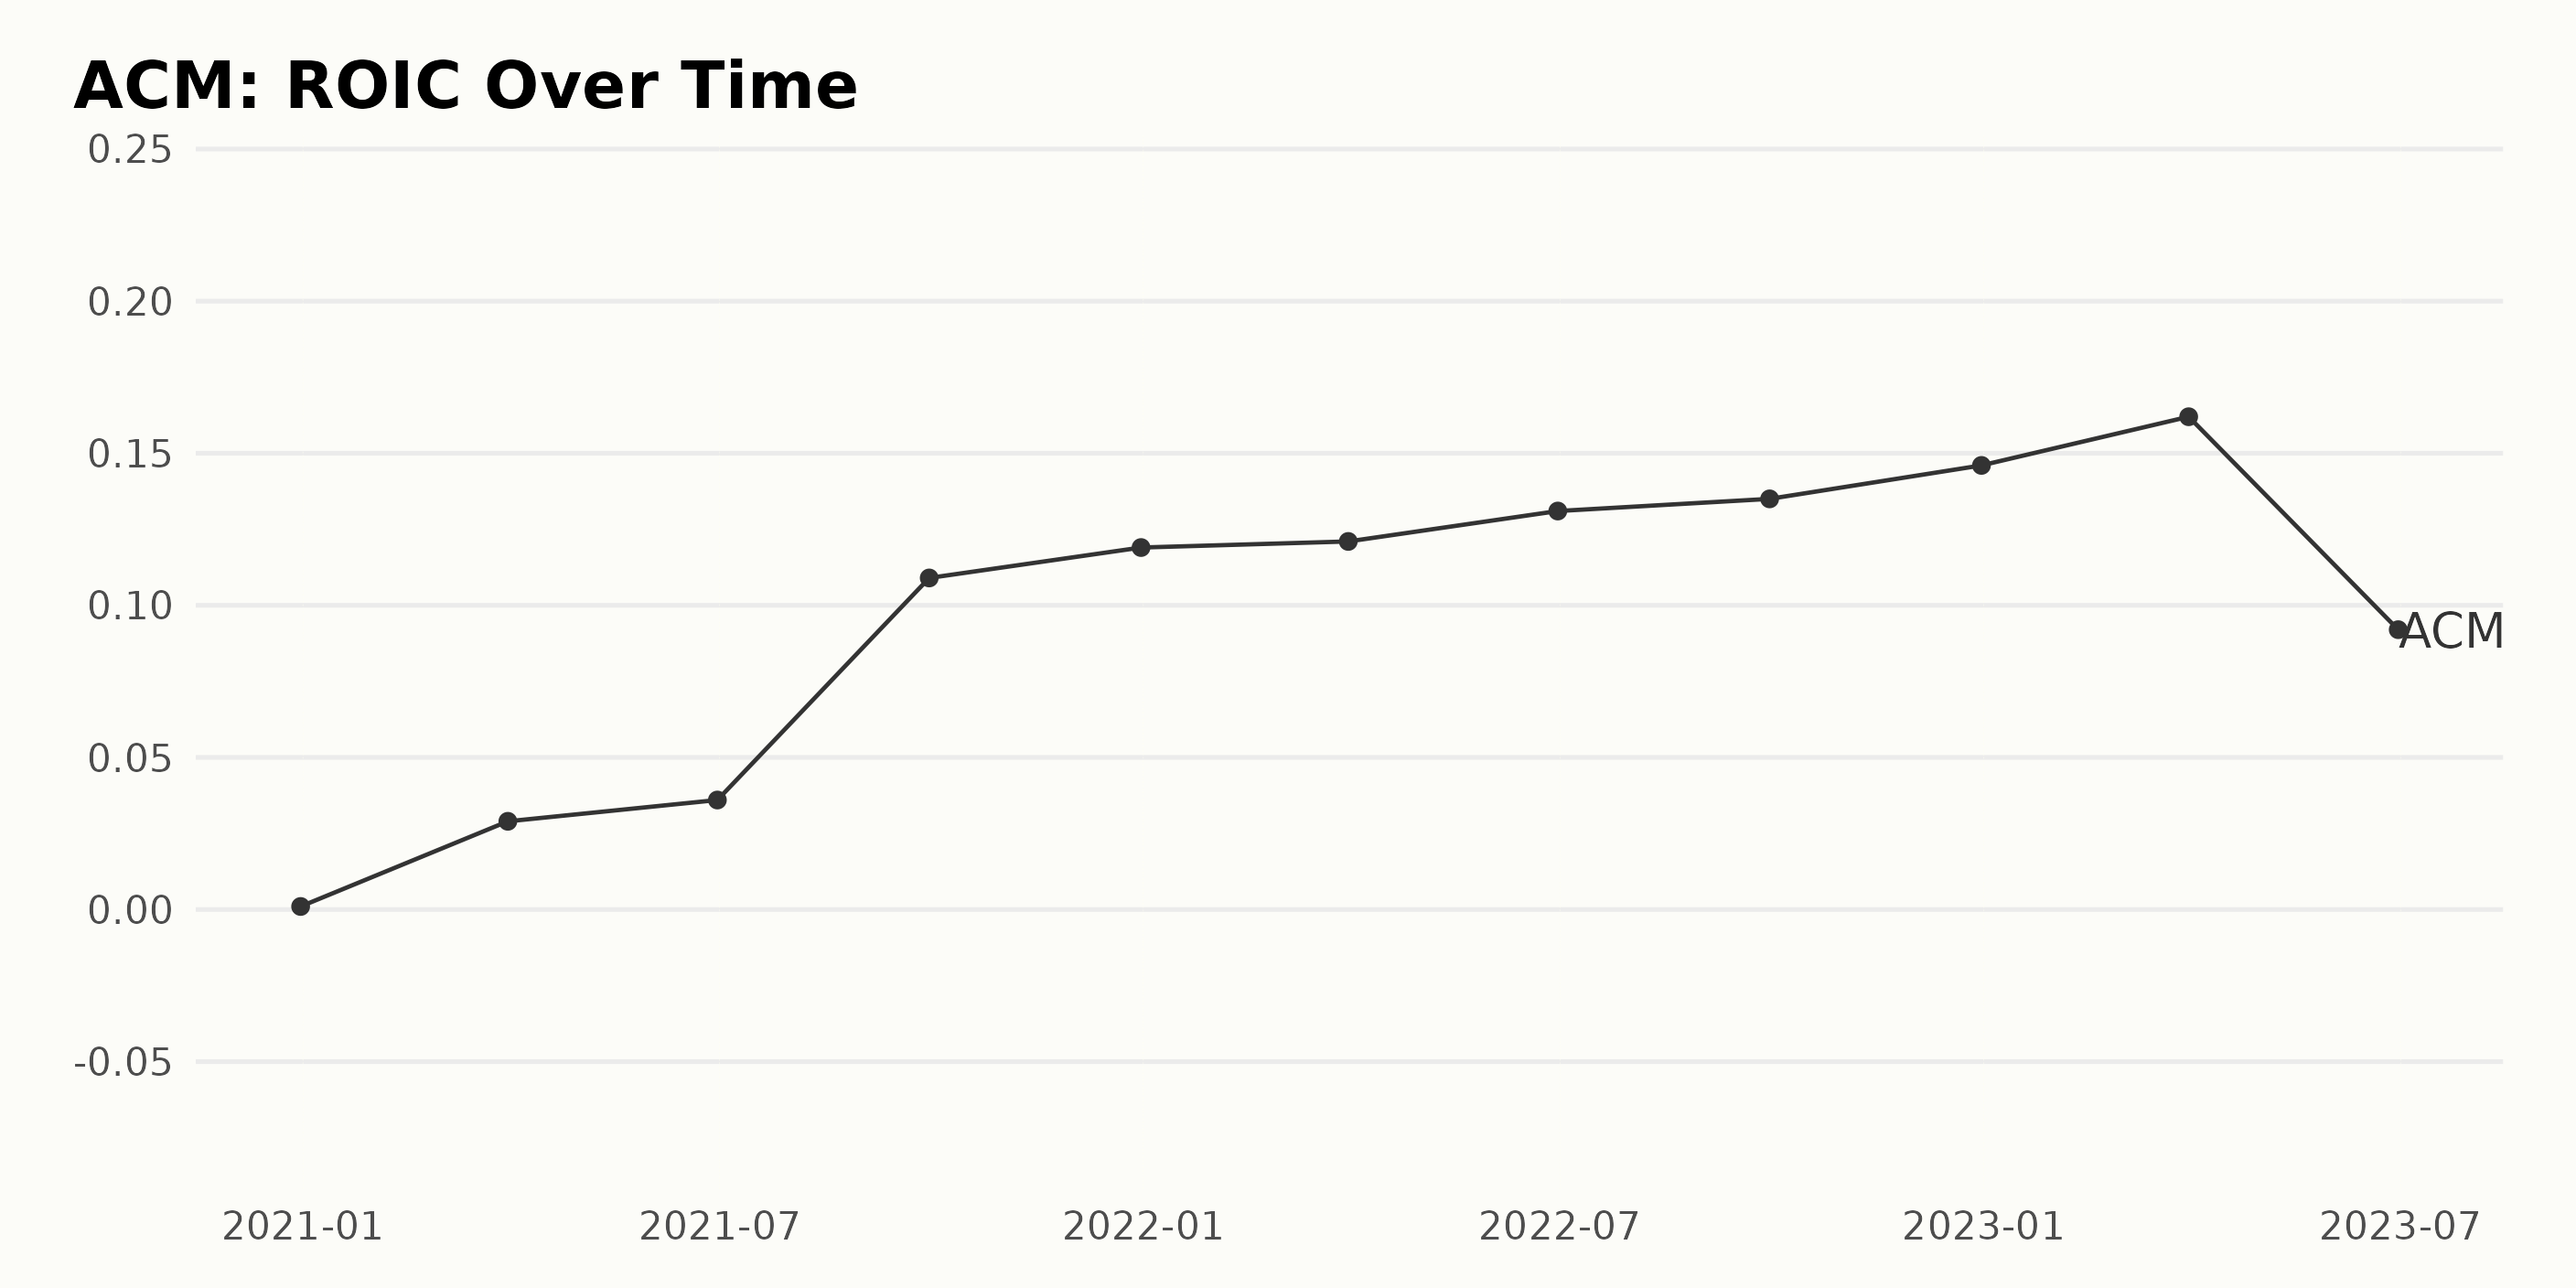
Based on the provided data, we observe a significant upward trend in the ROIC numbers of ACM spanning the period from December 2020 to June 2023.
- On December 31, 2020, the ROIC was at a very low 0.001.
- There was a notable surge to 0.029 by the end of the first quarter of 2021.
- This upward pattern continued steadily through 2021, with the year ending at 0.119.
- In 2022, the growth trend persisted. By year-end, the ROIC stood at 0.146, which denotes considerable growth when compared to 0.119 at the end of 2021.
- However, an unanticipated dip was observed in June 2023, with the ROIC reducing to 0.092 from that recorded in March 2023 (0.162).
The growth rate calculation between the first value (0.001) and the last value (0.092) shows a tremendous increase. This shows significant improvement in Return on Invested Capital for ACM over the said period; however, future assessments should be cautious of the recent dip in June 2023. The cause behind this drop back to two digits would need further investigation.
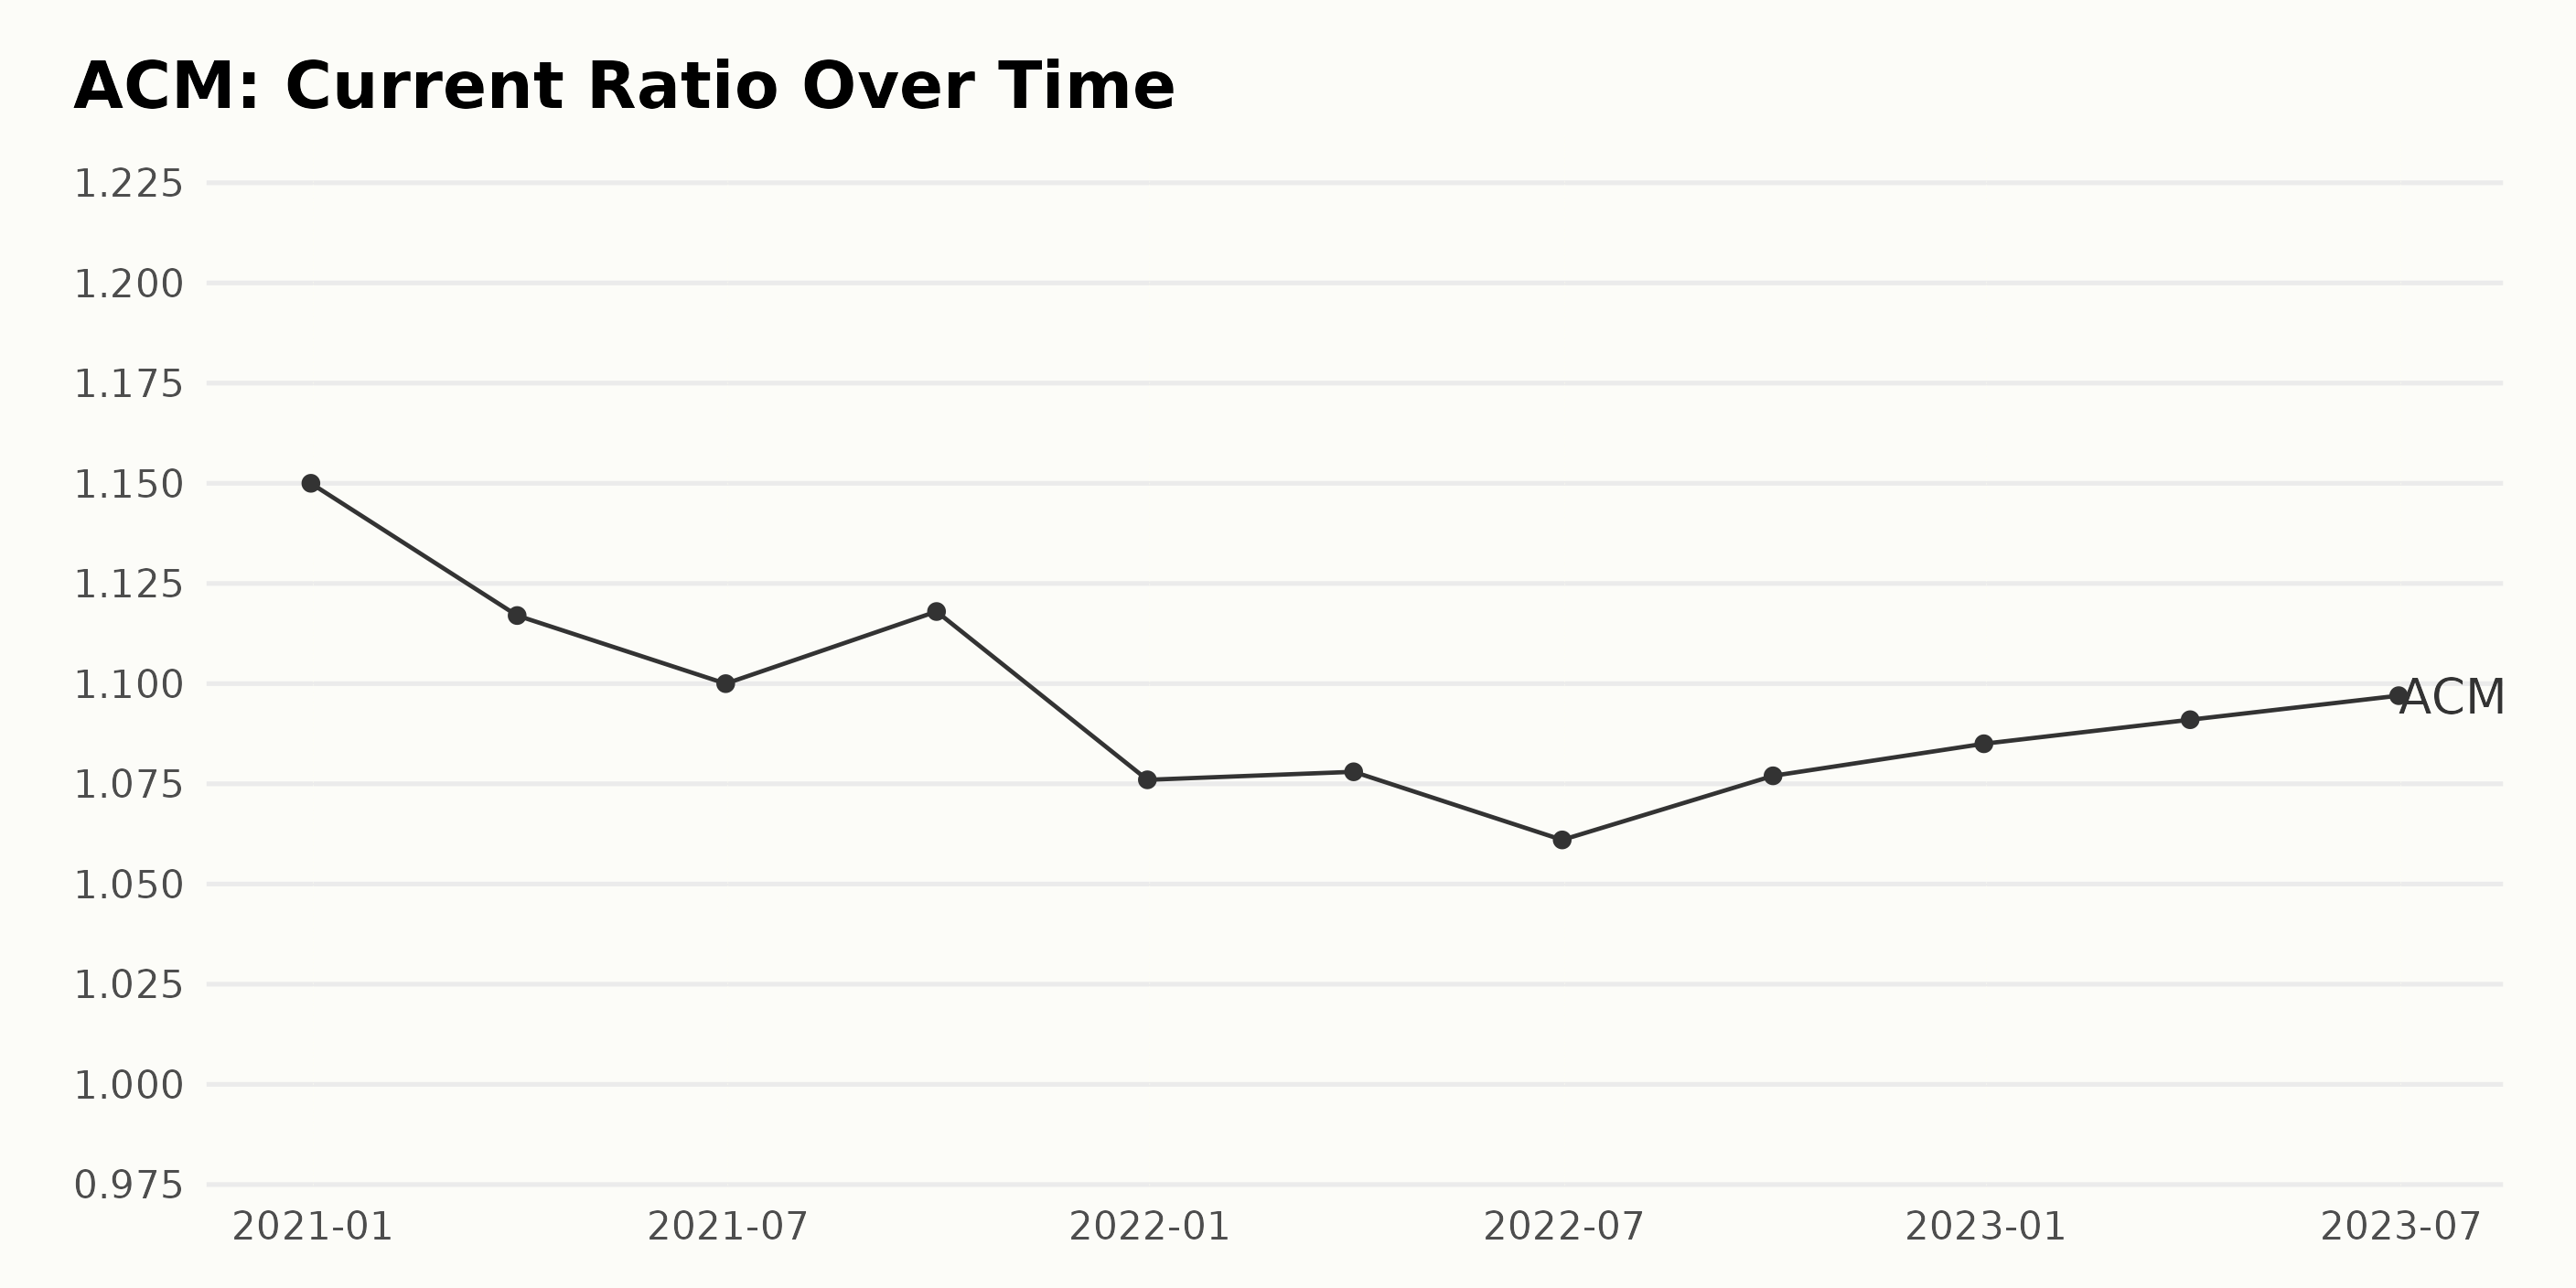
The data series represents the trend and fluctuations of the current ratio for ACM from December 2020 to June 2023.
- On December 31, 2020, the current ratio stood at 1.15.
- March 31, 2021, saw a slight decrease to 1.12.
- By June 30, 2021, it had further decreased to 1.1.
- In the third quarter ending on September 30, 2021, it showed a little increase, reaching 1.12.
- It ended 2021 on December 31 with a decreased ratio of 1.08.
- The first quarter of 2022 (March 31) saw a stable growth to 1.08, while the second quarter (June 30) reported a slight decrease to 1.06.
- In the third quarter of 2022 (September 30), it rebounded to 1.08.
- By the end of 2022, the current ratio stood at 1.09 in December.
- In the first quarter of 2023 (March 31), it slightly increased to 1.09.
- Finally, in the second quarter ending June 30, 2023, the data concludes with a current ratio level of 1.10.
Observations:
- The current ratio of ACM generally demonstrated a decreasing trend throughout the period of 2021. However, it started increasing again, albeit slowly, from the third quarter of 2022 onwards.
- From December 2020 to June 2023, the current ratio dropped from 1.15 to 1.10, indicating a negative growth rate of approximately 4.35% over the two-and-a-half-year period.
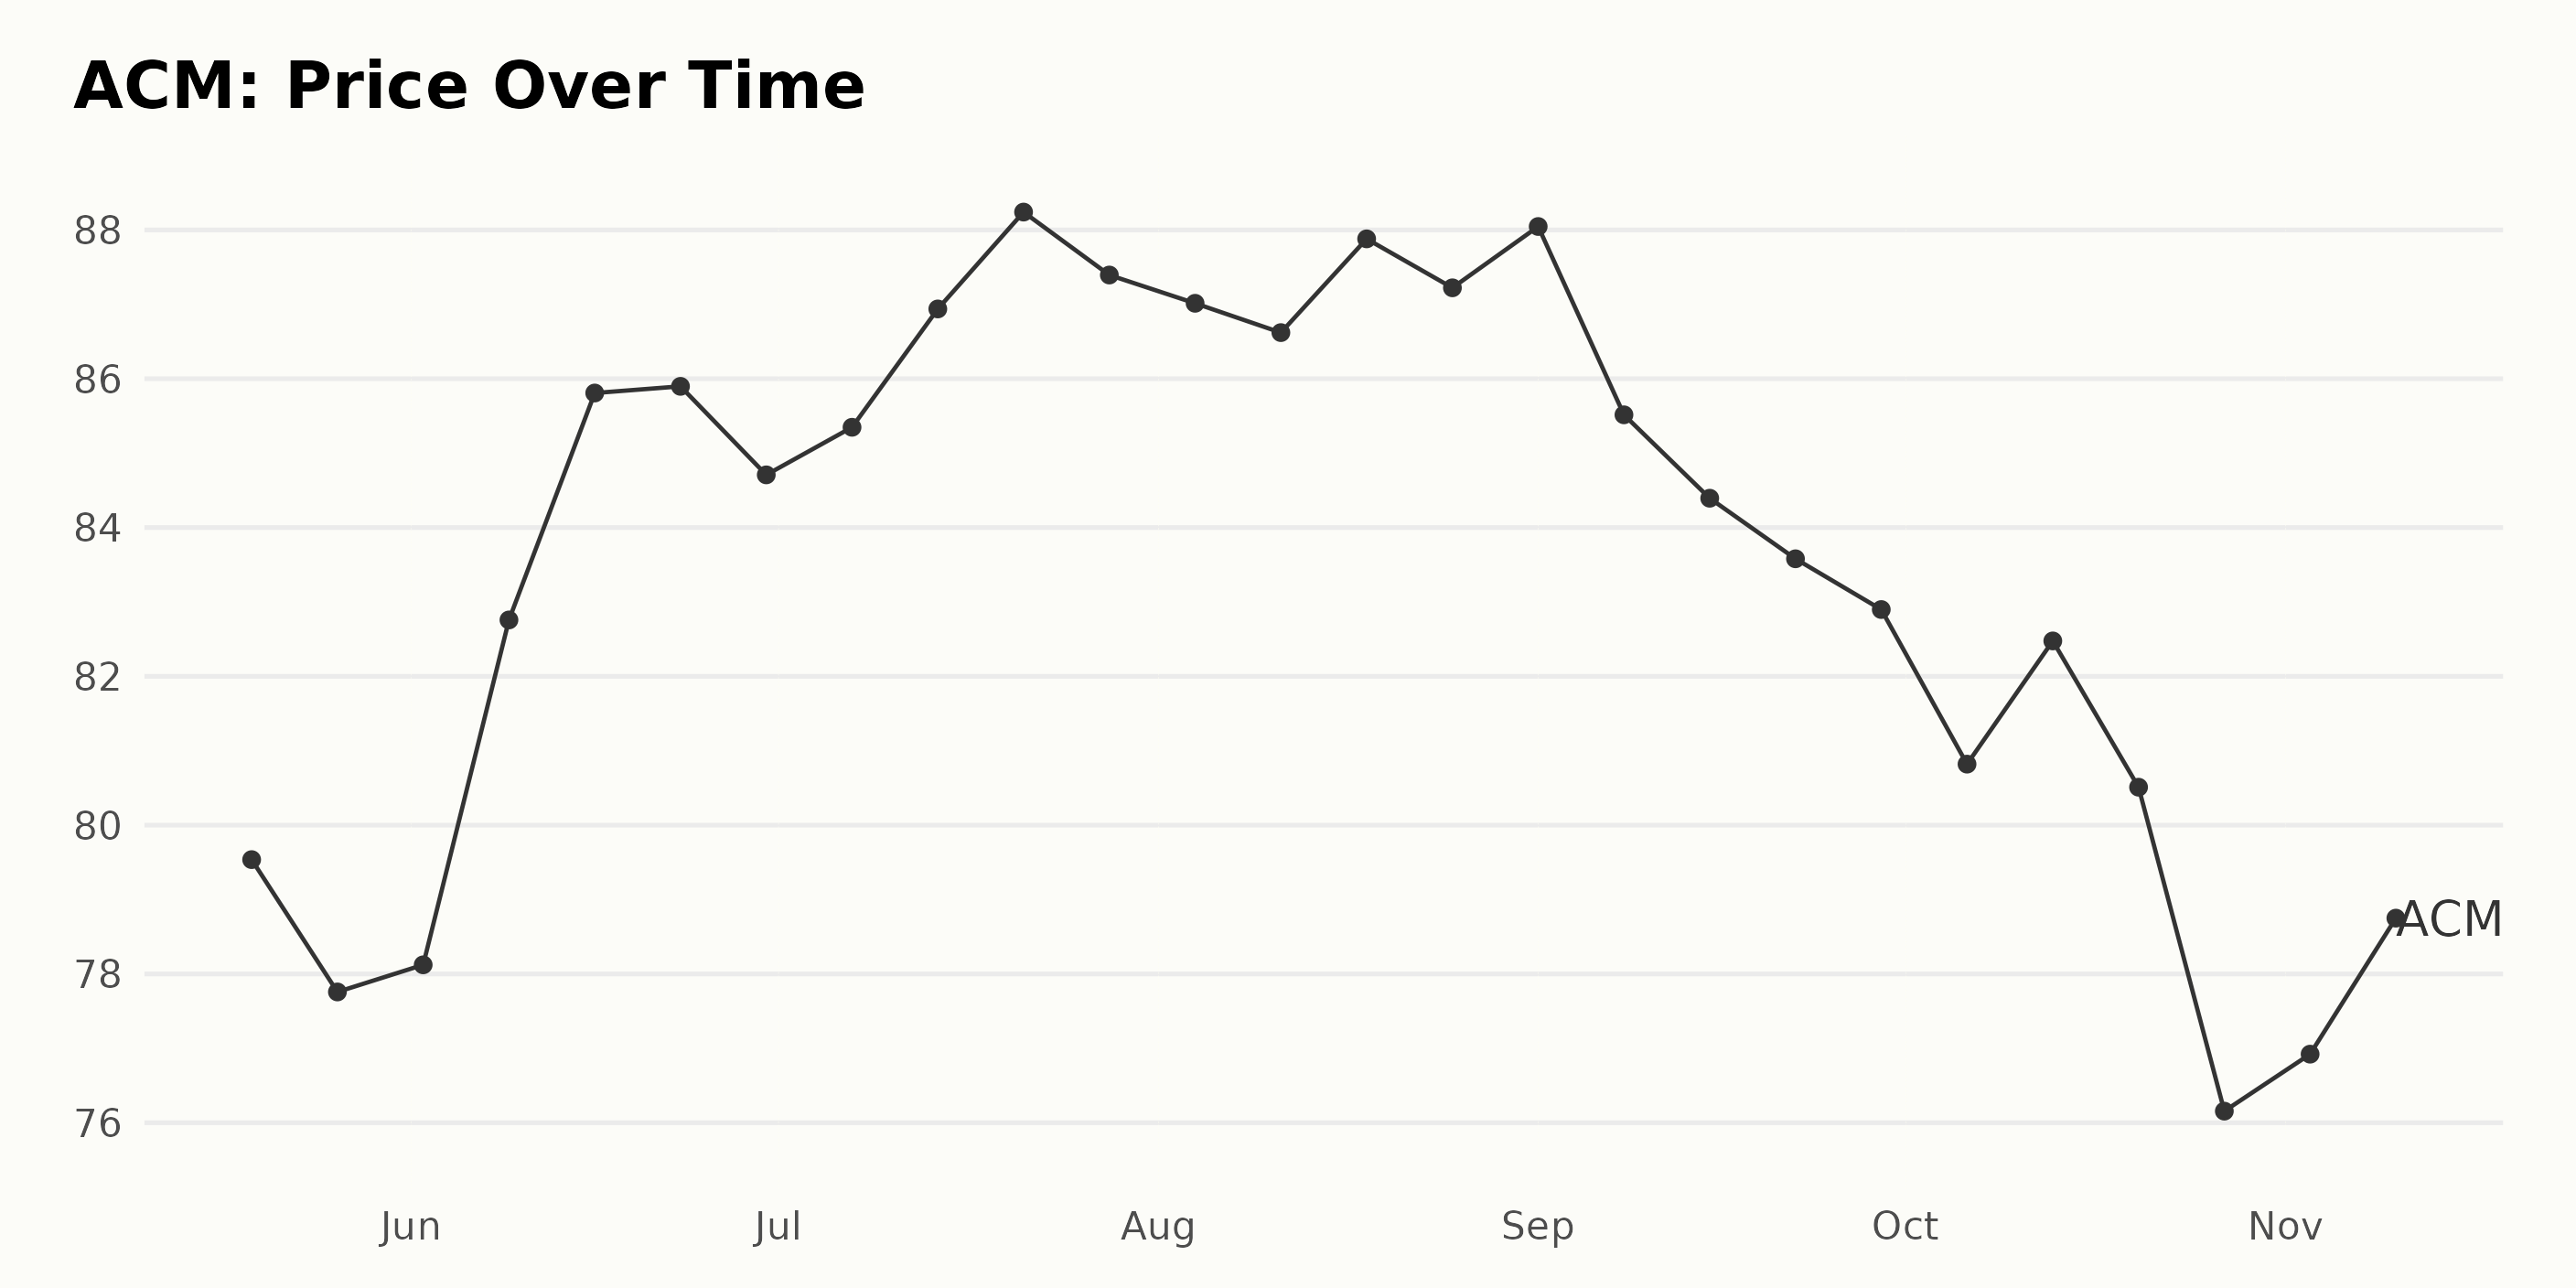
Tracking AECOM's Share Price Fluctuations from May to November 2023
Observing the trends of the share price evolution of ACM over the period from May 2023 to November 2023 can be summarized as follows:
- On May 19, 2023, its share price was $79.54.
- There was a slight decrease in the last week of May 2023, with the price dropping to $77.76 on May 26.
- In June 2023, the price gradually increased from $78.12 at the start of the month to $85.90 by the end of the month.
- Throughout July 2023, the trend continued to be bullish, seeing an overall increase and reaching a peak price of $88.24 on July 21. However, by the month's end, it had dropped slightly to $87.39.
- In August 2023, although there were minor fluctuations, the share value remained relatively consistent, closing the month at $87.22.
- The beginning of September 2023 saw a small increase to $88.04. However, this was followed by a downward price trend for the rest of the month, ending at $82.90 on September 29.
- October 2023 marked a steep deceleration in the price trend, with the lowest price point of $76.16 occurring on October 27.
- Despite this drop, the price began to recover slightly, moving into November 2023, closing at $80.31 on November 10.
Overall, during the observed period from May to November 2023, despite fluctuations, the ACM share price started at $79.54 and ended at $80.31, indicating a marginal net decrease over this period. A clear trend is an initial increase until July 21, followed by a continuous deceleration.
Here is a chart of ACM's price over the past 180 days.
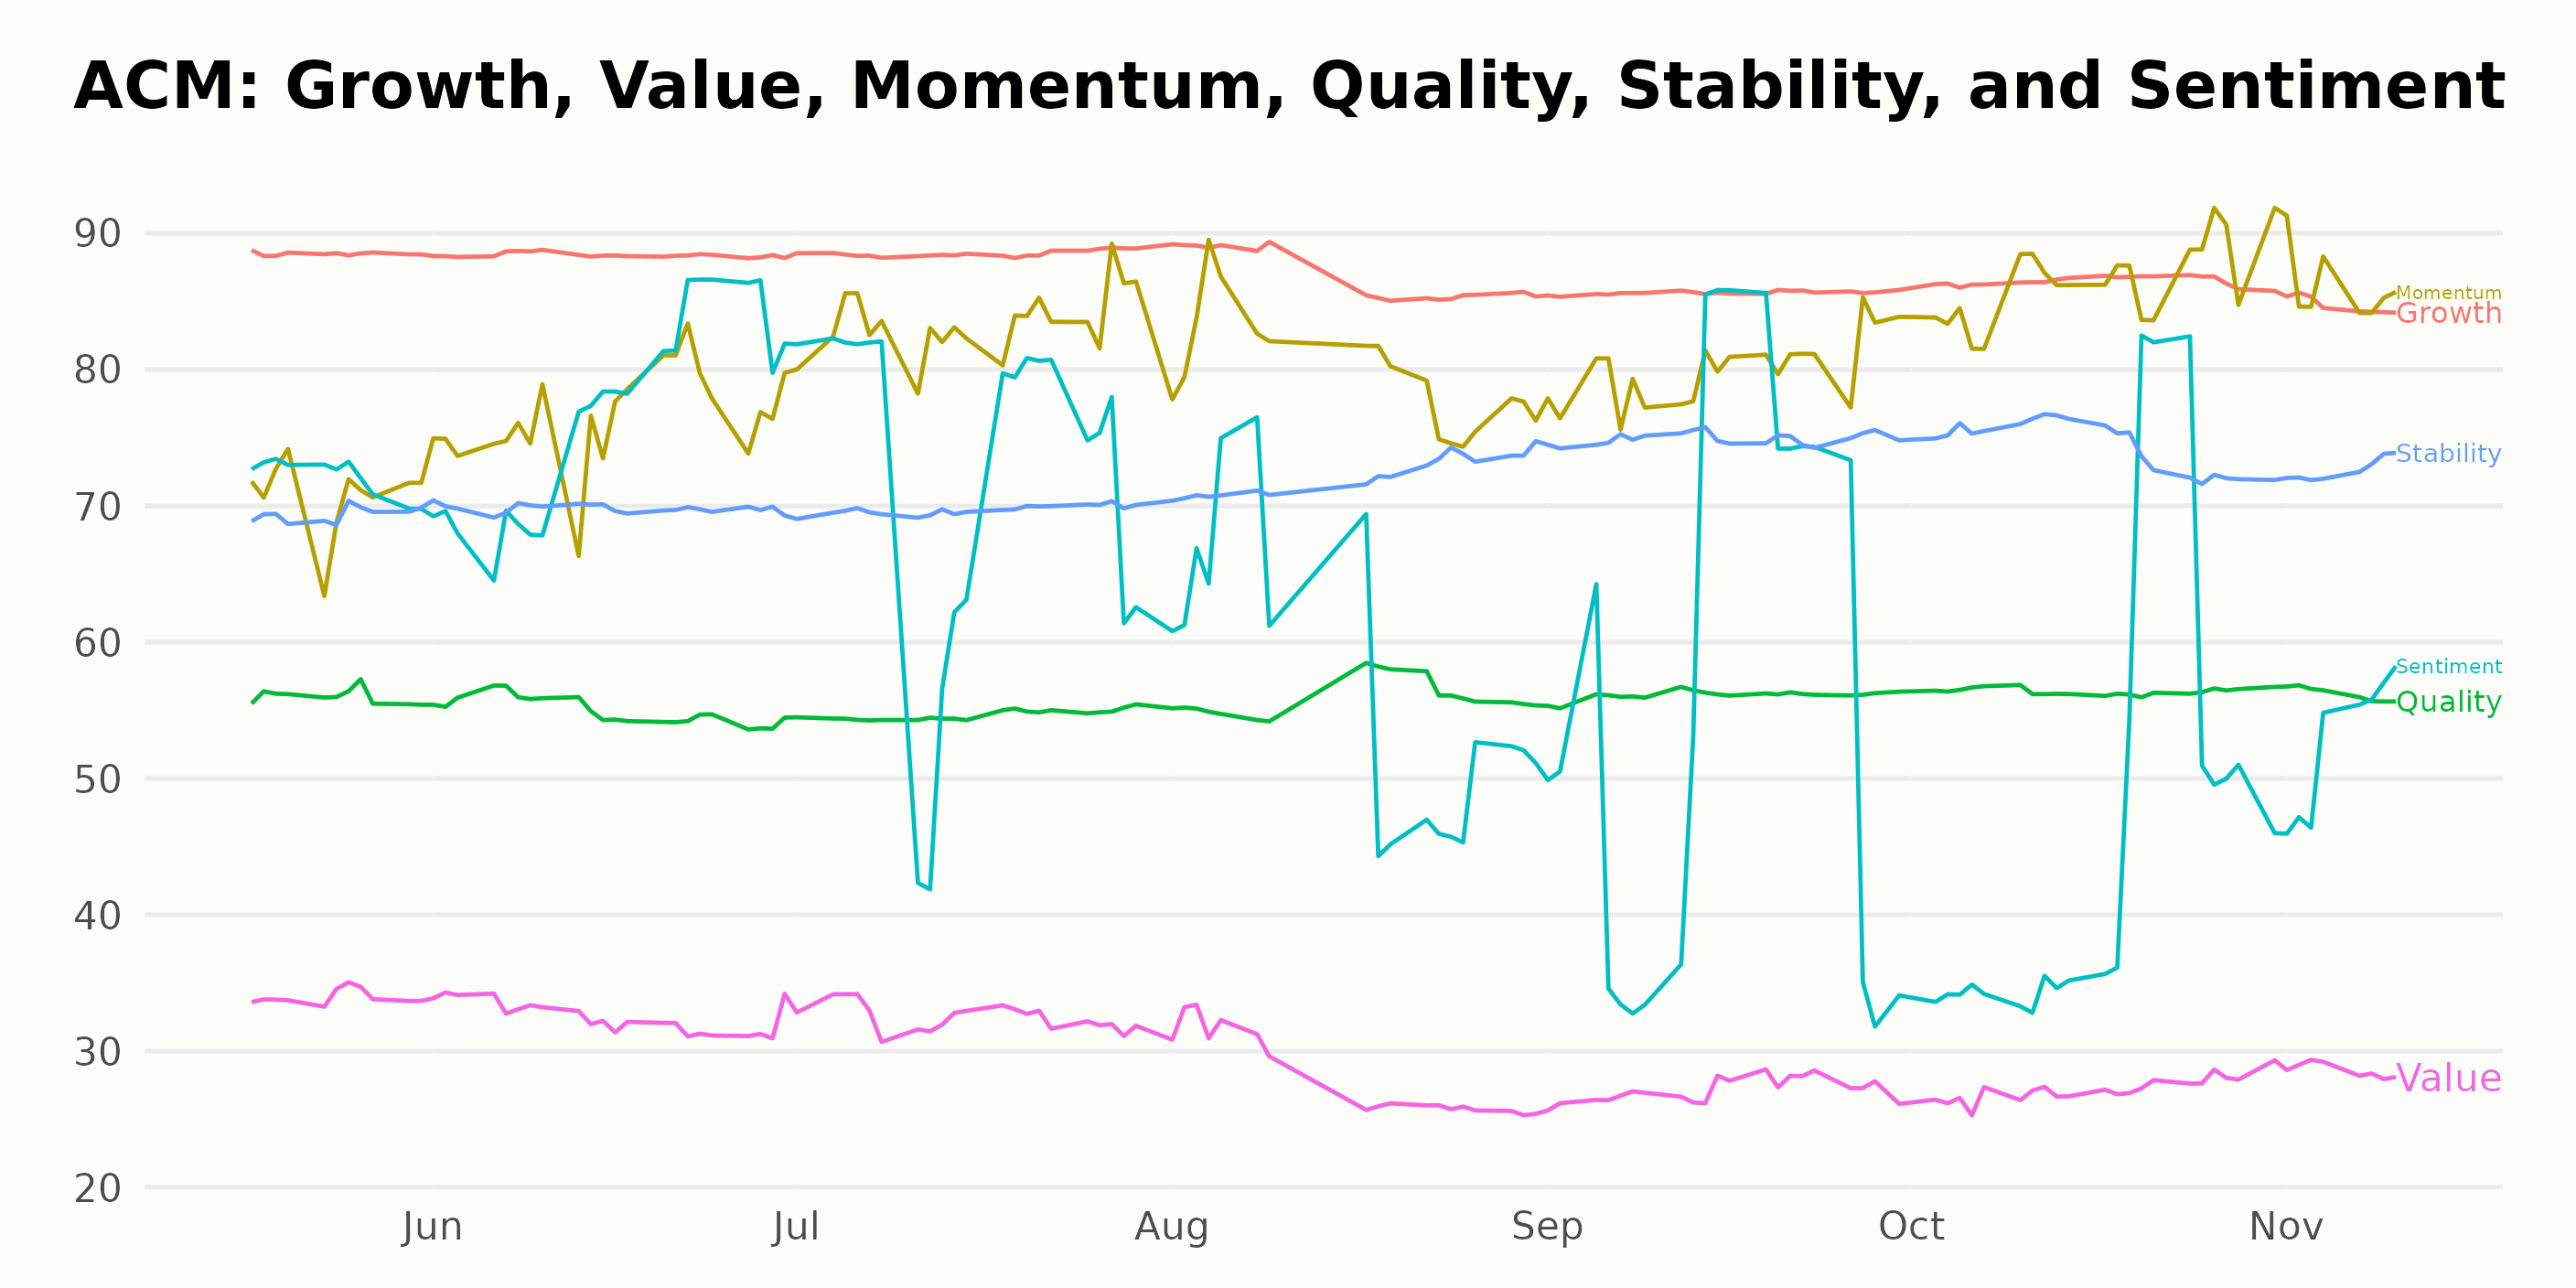
Evaluating Key Dimensions of AECOM's Performance: Growth, Momentum, and Stability
ACM, which belongs to the Industrial - Services category of stocks, has seen fluctuations in its POWR Ratings grade and rank in the category over the course of several months. Here are some key observations:
As per the given data, the latest value is from November 13, 2023. During this time, the POWR grade for ACM is C (Neutral), and it ranks #46 within the Industrial - Services category, which includes 81 stocks in total. C (Neutral) grade indicates average performance when compared with other stocks.
Reviewing its past performance, ACM maintained a B (Buy) grade for a significant period from May to August 2023. This indicates that the stock was generally ranked above the average during this span. The rank within its category also hovered around the mid-30s, which is a superior standing considering that lower values denote better rankings.
However, there were instances of the POWR grade dropping to C (Neutral) more frequently from July 2023. Notably, during the weeks of July 15 and from late August to September, and the second half of October, the stock's grade fell to C (Neutral). This happened again in early November, suggesting a reduction in its performance relative to other stocks.
Simultaneously, the rank within the category rose, reaching the late 40s in September and again in October. This indicates that ACM was not performing as strongly compared to its peers within the same category during these periods.
Please note that the POWR grades paint a general picture of the stock's performance, and various other factors must be considered for a comprehensive understanding of the stock market movements.
The three most significant dimensions for ACM in the POWR Ratings across the specified timeline are Growth, Momentum, and Stability. Key points across these three dimensions are detailed below:
Growth
- In May 2023, the Growth rating was 88 and showed a slow but steady upward trend through July of the same year, where it reached a peak value of 89.
- From August to November 2023, the Growth rating showed a moderate descending trend, falling from 87 to 85.
Momentum
- The Momentum rating started at 71 in May 2023 and consistently increased throughout the following months.
- It reached its peak at 87 in October 2023, after which it slightly fell to 86 in November 2023.
Stability
- The Stability dimension displayed an overall increasing trend across the considered period.
- Starting with a value of 69 in May 2023, the Stability rating maintained a slow but consistent rise to 75 by September, decreasing only slightly in the subsequent months.
In summary, while the Growth rating for AECOM showed a mild decrease over the given period, the Momentum and Stability ratings demonstrated positive trends. The Momentum dimension, specifically, showed significant growth throughout the period.
How does AECOM (ACM) Stack Up Against its Peers?
Other stocks in the Industrial - Services sector that may be worth considering are IES Holdings, Inc. (IESC), Koç Holding A.S. (KHOLY), and EMCOR Group, Inc. (EME) - they have better POWR Ratings. Click here to explore more Industrial - Services stocks.
What To Do Next?
Discover 10 widely held stocks that our proprietary model shows have tremendous downside potential. Please make sure none of these “death trap” stocks are lurking in your portfolio:
ACM shares were trading at $80.84 per share on Monday morning, up $0.53 (+0.66%). Year-to-date, ACM has declined -3.99%, versus a 16.61% rise in the benchmark S&P 500 index during the same period.
About the Author: Anushka Dutta

Anushka is an analyst whose interest in understanding the impact of broader economic changes on financial markets motivated her to pursue a career in investment research.
The post AECOM (ACM) Pre-Earnings Insights: An Industrial Stock to Watch? appeared first on StockNews.com