
(Please enjoy this updated version of my weekly commentary from the Reitmeister Total Return newsletter).
The S&P made yet another new high today at 4,392.37.
Impressive bull rally, right? WRONG!
Investors are once again playing by the 2020 playbook of just buying FAANG stocks which dominate the S&P making it look like a rally is taking place. Yet if things are so glorious why was the Russell 2000 down -1.88% today and down over -5% since the recent peak.
Let’s focus on what is really taking place and how to navigate our way forward.
Market Commentary
Check out the 1 month stock market heat map from FinViz.com below.
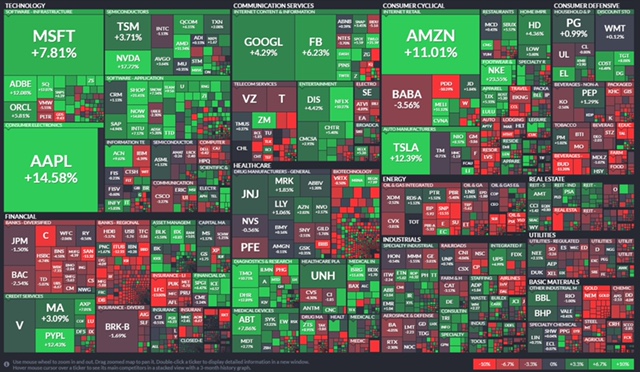
Notice the BIG blocks of green for the FAANG stocks and a few other well known large caps. Then look at how red dominates the rest of the page.
This means that we don’t really have a healthy bull market at this time as the new record highs for the S&P would imply. What you have is investors a bit shaken by recent market volatility and just hitting the “easy button” with FAANG stocks and other name brand large cap choices.
And in many ways we have not had a healthy, broadly advancing stock market since April when we had one of the strongest earnings seasons in recent memory.
The key question is WHY is this happening?
Higher Volatility > Flight to Safety > Cling to FAANG & other Safe Large Cap Stocks
And why do we have higher volatility?
Because the stock market does not normally rise 100% in a year like it did from the bear market bottom in March 2020. So it means the easy money has been made and many stocks are getting a bit stretched on the valuation front.
This leads to rounds of profit taking on some of the highest profile stocks. The famed ARK Innovation ETF (ARKK) is a prime example. With large holdings in TSLA, ROKU, TDOC, ZM and the like, the fund was recently down 36% from the February peak.
OK...that is a picture of the current situation. What does it mean going forward?
That is a somewhat unclear. What I will say with greater certainty is that we are still very much in a bull market. And likely that will last another 2-3 years. The reasons why were spelled out in last week’s RTR Members Only Webinar.
The trickier question is in the short run whether we will continue to endure all this volatility...sector rotation...lack of market breadth. Or will we have a more traditional bull run where more stocks come along for the ride?
I don’t pretend to have the answer. And anyone saying they know with great certainty has an elongating nose like Pinocchio ;-)
In this type of scenario it is best to align yourself with the primary market trend. And that is to be long stocks as they will trek higher at some point for which you don’t want to be left on the sidelines.
But because of the increased volatility and lack of clarity on the groups to pull ahead, then best to have a fairly diversified portfolio. This gives you improved odds of being in enough of the groups that lead the charge higher. And yes, I am confident our collection of 12 stocks and 2 ETFs is properly diversified in that way.
Now let’s turn our attention to the slate of economic reports over the last couple weeks to appreciate how it continues to support the long term bull market picture.
2 different home price indices show annual increases in average US home prices in the range of 15-16% . That is a positive to leads to more construction which is beneficial to economic health.
Unfortunately there is another side to this coin. And that is to appreciate the average annual increase for real estate is under 3%. Thus, things are getting a little too hot no doubt because of cheap money in the form of low rates. I bring this up now because the Fed should be worried about recreating the 2008 financial crisis.
Meaning that the downside of very low rates is equity bubbles and people taking on far too much risk that could be harmful to the economy. If the Fed starts to sense that is the case, then indeed we will make rates come up much faster than previously stated. And yes, that will have ripple effects for the market.
Both of the key employment reports came in well ahead of expectations. ADP showed 692,000 jobs added in June while the Government Employment Situation report showed and even more impressive 850,000.
Yet today we see that small business owners are saying they are finding it very hard to find the right labor to add. This shortage of the right labor will lead to paying more the entice talent to switch jobs which = wage inflation = a more persistent form of inflation than the transitory types the Fed are currently in the mix. (Yes, I think inflation is hotter than the Fed states which is why I continue to short the bond market as rising rates should be as natural in this economic environment as night following day).
ISM Manufacturing is still impressive at 60.6. While New Orders came in at 66 pointing to more good times ahead. ISM Services was not far behind at 60.1 with New Orders up at 62.1.
Add up all the these signs of an improving economy and it is hard to be negative on the stock market.
The next hurdle to clear is Q2 earnings season. The last few quarters have proven to be well ahead of Wall Street expectations. The downside of that statement is that expectations keep ratcheting higher. Thus, all the harder to impress investors.
Typically when that is the case, then there are some early bellwethers who fall short of lofty expectations. This leads to everyone quickly lowering expectations for the rest of earnings season with most companies enjoying a more favorable response to their announcements.
What To Do Next?
The Reitmeister Total Return portfolio has outperformed the market by a wide margin this year.
Why such a strong outperformance?
Because I hand-pick the very best stocks from across the POWR Ratings universe. In fact right now there are 12 Buy rated stocks and 2 ETFs in the portfolio ready to excel in the days and weeks ahead.
If you would like to see the current portfolio, then start a 30 day trial by clicking the link below.
About Reitmeister Total Return newsletter & 30 Day Trial
Wishing you a world of investment success!

Steve Reitmeister
…but everyone calls me Reity (pronounced “Righty”)
CEO, Stock News Network and Editor, Reitmeister Total Return
SPY shares were trading at $435.21 per share on Wednesday morning, down $0.38 (-0.09%). Year-to-date, SPY has gained 17.17%, versus a % rise in the benchmark S&P 500 index during the same period.
About the Author: Steve Reitmeister

Steve is better known to the StockNews audience as “Reity”. Not only is he the CEO of the firm, but he also shares his 40 years of investment experience in the Reitmeister Total Return portfolio. Learn more about Reity’s background, along with links to his most recent articles and stock picks.
The post Is the Bull Market Running Out of Steam? appeared first on StockNews.com