


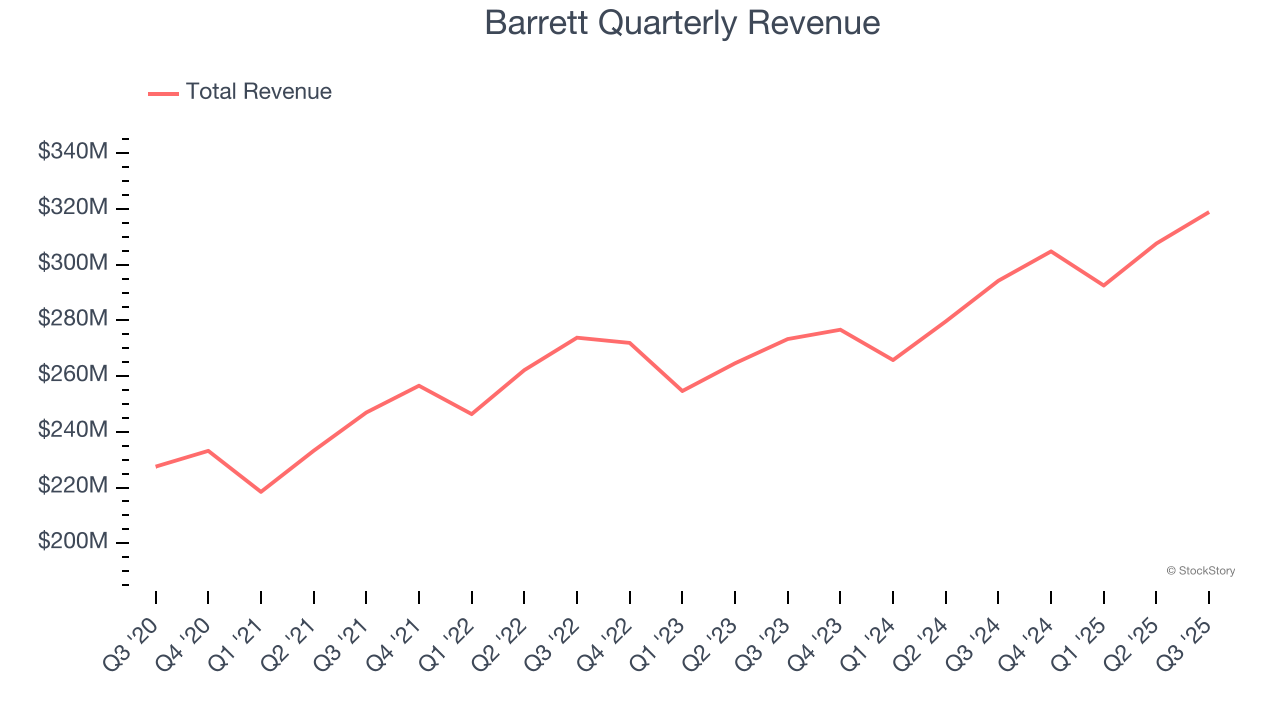
Business management solutions provider Barrett Business Services (NASDAQ: BBSI) met Wall Streets revenue expectations in Q3 CY2025, with sales up 8.4% year on year to $318.9 million. Its GAAP profit of $0.79 per share was 1.3% below analysts’ consensus estimates.
Is now the time to buy Barrett? Find out by accessing our full research report, it’s free for active Edge members.
Barrett (BBSI) Q3 CY2025 Highlights:
- Revenue: $318.9 million vs analyst estimates of $319.3 million (8.4% year-on-year growth, in line)
- EPS (GAAP): $0.79 vs analyst expectations of $0.80 (1.3% miss)
- Adjusted EBITDA: $26.88 million vs analyst estimates of $29.13 million (8.4% margin, 7.7% miss)
- Operating Margin: 7.8%, in line with the same quarter last year
- Market Capitalization: $1.03 billion
“BBSI delivered another strong quarter of controllable growth driven by new client additions,” said Gary Kramer, President and CEO of BBSI.
Company Overview
Operating as a professional employer organization (PEO) that serves over 8,000 companies with more than 120,000 worksite employees, Barrett Business Services (NASDAQ: BBSI) provides management solutions that help small and mid-sized businesses handle human resources, payroll, workers' compensation, and other administrative functions.
Revenue Growth
Reviewing a company’s long-term sales performance reveals insights into its quality. Any business can put up a good quarter or two, but the best consistently grow over the long haul.
With $1.22 billion in revenue over the past 12 months, Barrett is a small player in the business services space, which sometimes brings disadvantages compared to larger competitors benefiting from economies of scale and numerous distribution channels. On the bright side, it can grow faster because it has more room to expand.
As you can see below, Barrett’s 6.5% annualized revenue growth over the last five years was decent. This shows its offerings generated slightly more demand than the average business services company, a useful starting point for our analysis.
We at StockStory place the most emphasis on long-term growth, but within business services, a half-decade historical view may miss recent innovations or disruptive industry trends. Barrett’s annualized revenue growth of 7.2% over the last two years aligns with its five-year trend, suggesting its demand was stable. 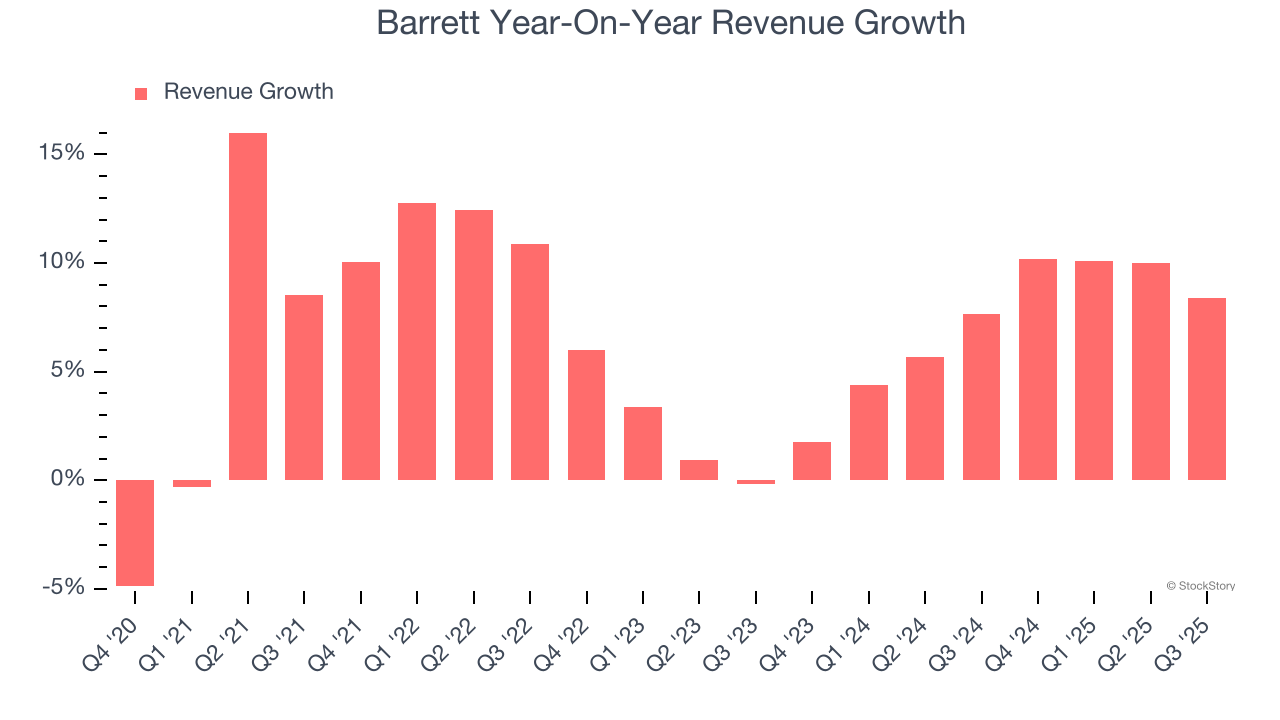
This quarter, Barrett grew its revenue by 8.4% year on year, and its $318.9 million of revenue was in line with Wall Street’s estimates.
Looking ahead, sell-side analysts expect revenue to grow 7.4% over the next 12 months, similar to its two-year rate. This projection is healthy and indicates the market is forecasting success for its products and services.
Microsoft, Alphabet, Coca-Cola, Monster Beverage—all began as under-the-radar growth stories riding a massive trend. We’ve identified the next one: a profitable AI semiconductor play Wall Street is still overlooking. Go here for access to our full report.
Operating Margin
Barrett was profitable over the last five years but held back by its large cost base. Its average operating margin of 5.1% was weak for a business services business.
On the plus side, Barrett’s operating margin rose by 1 percentage points over the last five years, as its sales growth gave it operating leverage.
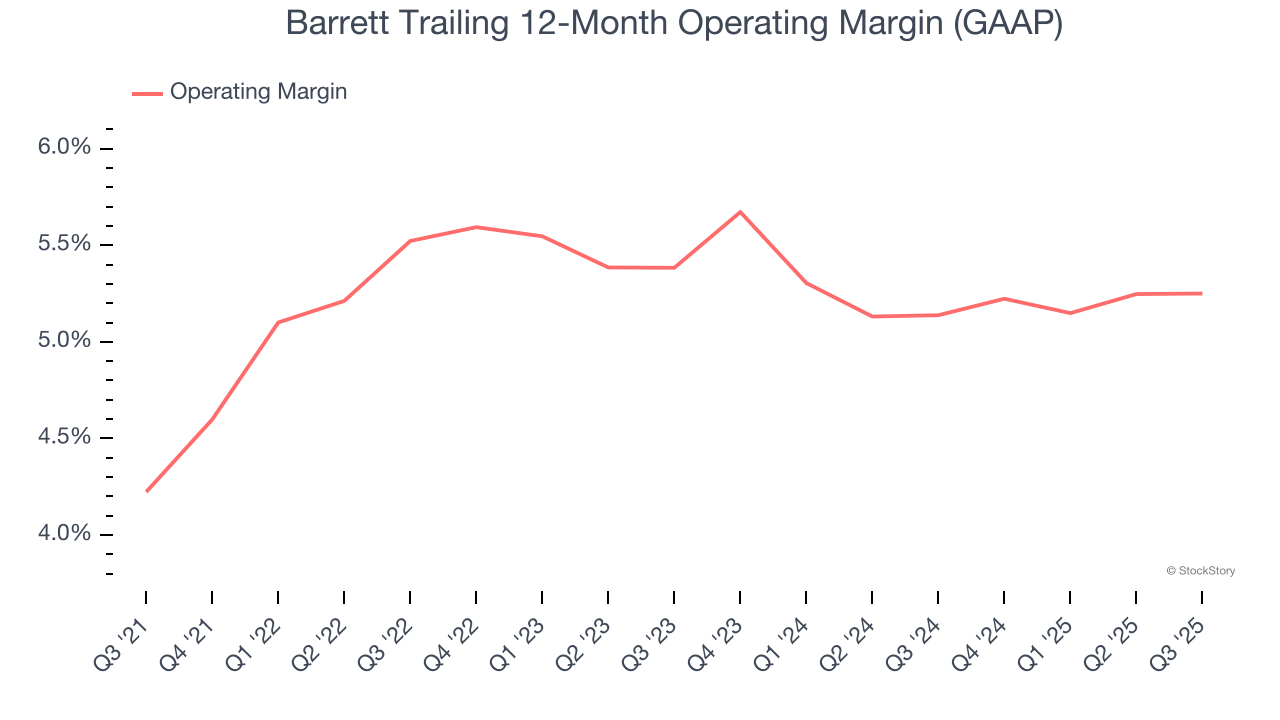
This quarter, Barrett generated an operating margin profit margin of 7.8%, in line with the same quarter last year. This indicates the company’s overall cost structure has been relatively stable.
Earnings Per Share
Revenue trends explain a company’s historical growth, but the long-term change in earnings per share (EPS) points to the profitability of that growth – for example, a company could inflate its sales through excessive spending on advertising and promotions.
Barrett’s EPS grew at a remarkable 10.9% compounded annual growth rate over the last five years, higher than its 6.5% annualized revenue growth. This tells us the company became more profitable on a per-share basis as it expanded.
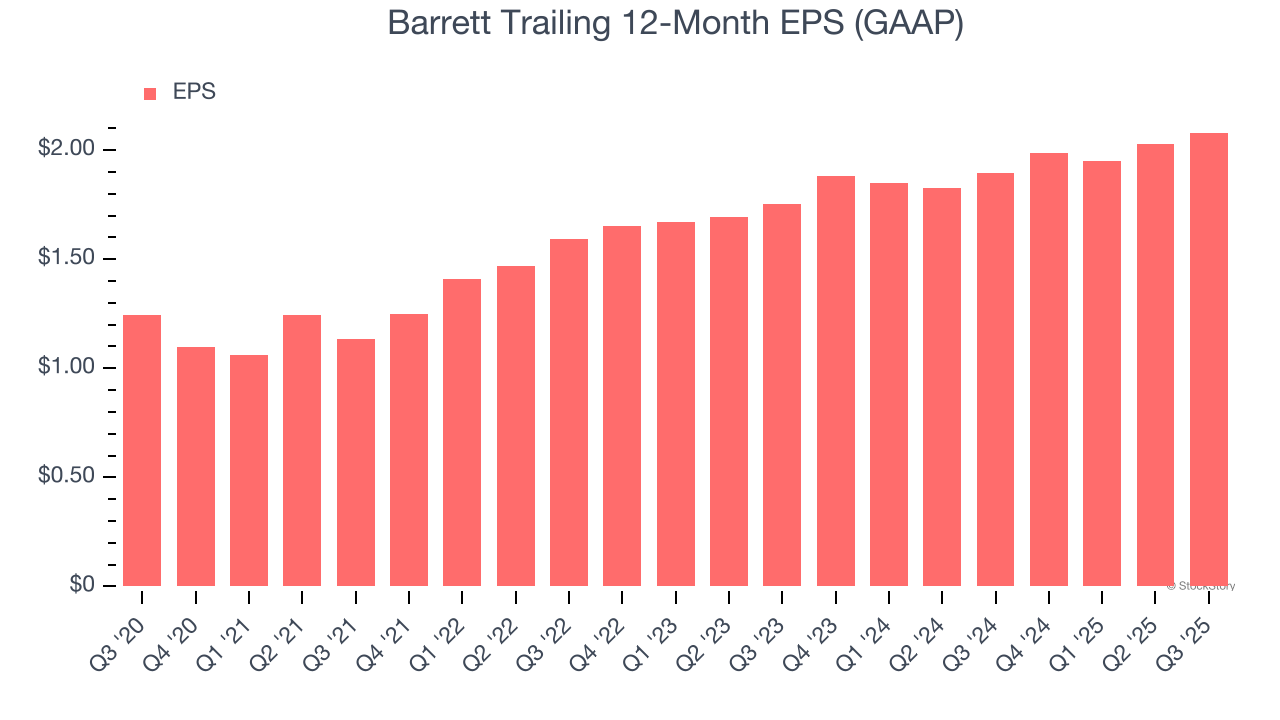
Diving into the nuances of Barrett’s earnings can give us a better understanding of its performance. As we mentioned earlier, Barrett’s operating margin was flat this quarter but expanded by 1 percentage points over the last five years. On top of that, its share count shrank by 15.1%. These are positive signs for shareholders because improving profitability and share buybacks turbocharge EPS growth relative to revenue growth. 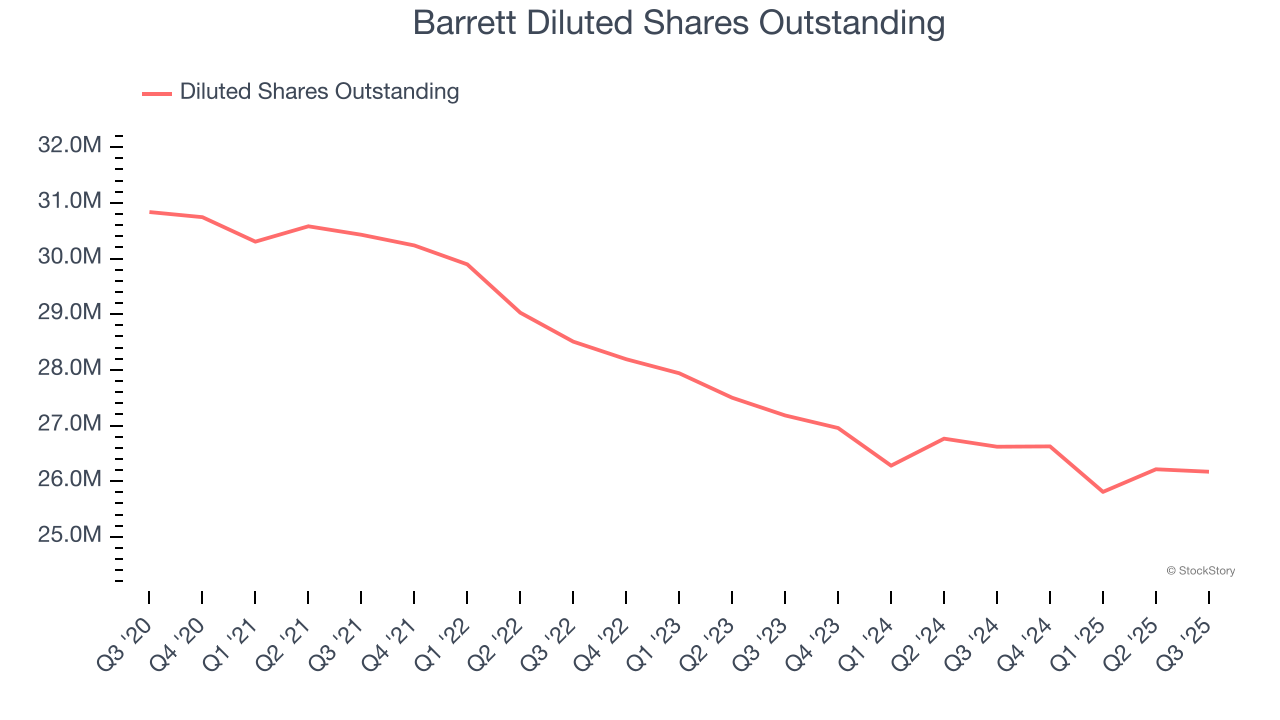
Like with revenue, we analyze EPS over a shorter period to see if we are missing a change in the business.
For Barrett, its two-year annual EPS growth of 8.9% was lower than its five-year trend. We hope its growth can accelerate in the future.
In Q3, Barrett reported EPS of $0.79, up from $0.74 in the same quarter last year. Despite growing year on year, this print slightly missed analysts’ estimates, but we care more about long-term EPS growth than short-term movements. Over the next 12 months, Wall Street expects Barrett’s full-year EPS of $2.08 to grow 15.6%.
Key Takeaways from Barrett’s Q3 Results
We struggled to find many positives in these results. EPS missed, making for a weaker quarter. The stock remained flat at $40.72 immediately after reporting.
Barrett may have had a tough quarter, but does that actually create an opportunity to invest right now? If you’re making that decision, you should consider the bigger picture of valuation, business qualities, as well as the latest earnings. We cover that in our actionable full research report which you can read here, it’s free for active Edge members.


