

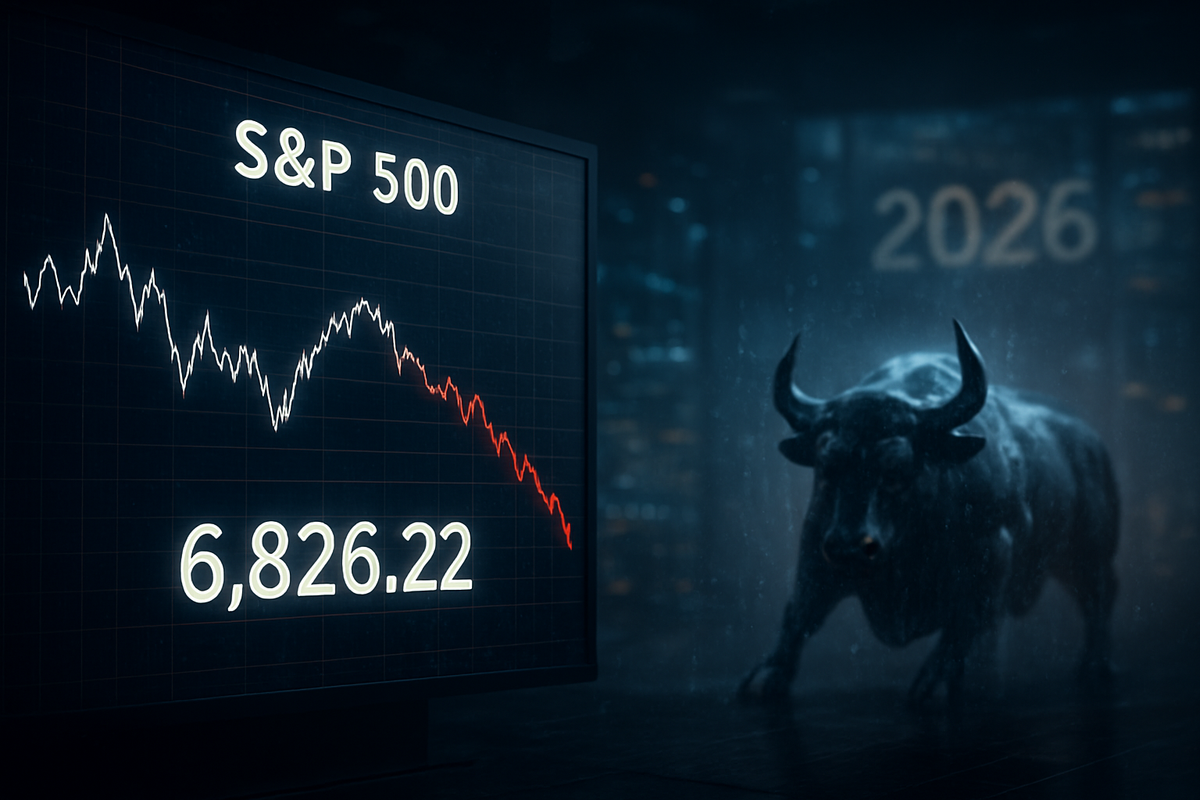
As the final trading sessions of 2025 draw to a close, the S&P 500 (INDEXSP:.INX) is grappling with a bout of technical exhaustion that has dampened the spirits of an otherwise stellar year. After coming within striking distance of the historic 7,000-point threshold, the index has retreated, posting back-to-back losses that have analysts questioning whether the "Santa Claus Rally" has officially run out of steam. This late-December wobble is more than just a seasonal breather; it represents a significant psychological and technical test for a market that has been fueled by aggressive AI investment and resilient, albeit "sticky," economic data.
The immediate implications of this pullback are twofold. First, it underscores the formidable resistance at the 7,000 level, a psychological barrier that has triggered a wave of profit-taking among institutional investors. Second, the back-to-back losses have shifted the focus toward the 2026 outlook, which many strategists describe as "resilient but unstable." With the index currently hovering around 6,930, the failure to reclaim record highs before the new year suggests that the momentum of 2025 may be yielding to a more cautious, data-dependent environment as the market prepares for the challenges of a midterm election year.
Technical Resistance and the 7,000 Ceiling
The S&P 500’s struggle to maintain its record highs is the culmination of a weeks-long battle with the 7,000 mark. Throughout December 2025, the index repeatedly tested this level, only to be met with significant selling pressure. The timeline of this stagnation began in mid-December when the index hit a peak of 6,985, buoyed by optimistic earnings guidance for the coming year. However, as the final two weeks of the year unfolded, a lack of fresh catalysts and rising concerns over "sticky" inflation—projected to remain around 2.4% to 3% through 2026—stalled the upward trajectory.
The recent back-to-back losses were triggered by a combination of light holiday trading volume and a hawkish tilt in the Federal Reserve's latest "Dot Plot" commentary, which suggested that rate cuts in 2026 might be fewer than the market had initially priced in. Key stakeholders, including major asset managers like BlackRock (NYSE: BLK) and Vanguard, have noted that the market's high valuation—with the CAPE ratio currently sitting at a staggering 40.6—leaves little room for error. Initial market reactions to the slide have seen the CBOE Volatility Index (INDEXCBOE:VIX) tick upward, reflecting a growing sense of unease as the index tests its 50-day moving average near 6,790.
Winners and Losers in a Cooling Market
In this environment of technical friction, the "Magnificent Seven" and other AI-centric firms continue to be the primary drivers of market sentiment. Nvidia (NASDAQ: NVDA) and Microsoft (NASDAQ: MSFT) remain the "winners" in terms of fundamental strength, with 2026 earnings growth for the tech sector projected at a robust 30.4%. These companies have acted as a safety net for the index, preventing a deeper correction even as broader market breadth narrows. However, their extreme concentration—now representing nearly 38% of the S&P 500's total value—means that any technical breakdown in these names could lead to a disproportionate index-wide slump.
Conversely, the "losers" in this year-end transition are largely found in the consumer discretionary and retail sectors. Companies like Walmart (NYSE: WMT) and Target (NYSE: TGT) are facing headwinds from potential tariff-induced cost increases and a consumer base that is beginning to feel the pinch of prolonged high interest rates. Additionally, the banking sector, led by giants like JPMorgan Chase & Co. (NYSE: JPM), is seeing a mixed bag; while higher interest rates have boosted net interest margins, the prospect of a slowing labor market and reduced loan demand in 2026 is tempering investor enthusiasm.
Broader Significance and Historical Precedents
The current struggle of the S&P 500 fits into a broader trend of "valuation contraction" that often follows periods of rapid, AI-driven expansion. Historically, when the S&P 500 enters a year with a CAPE ratio above 35, the subsequent 12 months are characterized by increased volatility and lower-than-average returns. Furthermore, 2026 is a midterm election year in the United States, a period that historically sees an average intra-year drawdown of 18%. The current back-to-back losses may be the market's way of "pre-pricing" this historical volatility.
The ripple effects of this technical fatigue are also being felt in global markets. As the U.S. index stumbles, investors are closely watching the Federal Reserve's navigation toward a "neutral" rate, currently projected between 3.25% and 3.50% by the end of 2026. Any deviation from this path, especially if prompted by tariff-related inflationary spikes, could force a re-evaluation of global equity risk premiums. This mirrors the late-1990s era, where high valuations and technological shifts created a "melt-up" environment that eventually required a painful period of price discovery.
The Road Ahead: 2026 Scenarios
Looking ahead to the first quarter of 2026, the S&P 500 faces two primary scenarios. In the "bull case," championed by firms like Evercore and Morgan Stanley, the index could shrug off its current malaise and surge toward 8,000 or even 9,000 if AI-driven productivity gains translate into a significant corporate earnings beat. This would require the Federal Reserve to successfully orchestrate a "soft landing" while inflation continues its slow descent toward the 2% target.
In the "bear case," the current back-to-back losses are a precursor to a deeper correction. If the support level at 6,760 fails to hold, the index could see a 10-15% drawdown as investors rotate out of overvalued tech stocks and into defensive assets. Strategic pivots will be required for institutional players, who may move toward "quality" stocks with strong balance sheets and consistent dividend growth to weather the midterm election year's typical turbulence. The emergence of new trade policies and their impact on the global supply chain will be the "X-factor" that determines which scenario plays out.
Final Assessment and Investor Takeaways
The technical state of the S&P 500 at the end of 2025 is one of cautious transition. While the year has provided exceptional returns, the inability to clear the 7,000 hurdle and the recent back-to-back losses serve as a reminder that momentum is not infinite. The 2026 outlook is promising, with a consensus earnings growth target of 15.5%, but the path to those gains will likely be marred by higher volatility and significant sector rotation.
For investors, the key takeaways are clear: watch the 6,760 and 6,790 support levels closely in the coming weeks. A break below these marks would signal a shift in the medium-term trend. Moving into 2026, the focus should remain on earnings quality and the Federal Reserve’s reaction to "sticky" inflation data. While the long-term trajectory of the S&P 500 remains tied to the transformative power of AI, the immediate future belongs to the macroeconomists and the technical analysts who must navigate a market that is finally feeling the weight of its own success.
This content is intended for informational purposes only and is not financial advice


