

 Consumer cleaning products maker Clorox (NYSE: CLX) stock skyrocketed during the pandemic from unprecedented demand for its cleaning supplies but have since fallen below pandemic levels. While a reversion from its nosebleed levels is to be expected, investors ponder if the Mr. Market has overly punished its shares. Markets tend to overshoot both ways up and down. It’s clear in hindsight that Clorox overshot to the upside when it hit highs of $237.94 in August 2020 and lost nearly half its value as it crashed through its pandemic low hitting a swing low of $120.50 in June 2022. Prior to the pandemic, it’s annual revenue growth was 1.5% in 2019, which ramped up significantly to 8% to 9% during the pandemic years of 2020 through 2021. A normalization in its business and stock price is expected after an outlier event like COVID-19. However, investors wonder if the sell-off is too much of an overshot to the downside leaving the stock worse off than before the pandemic. Clorox benefits from favorable exchange rates and price increases. Afterall, Clorox was not meant to be a momentum stock, but the sentiment has completely turned 180 degrees turning a pandemic darling into a post-pandemic pariah.
Industry Deceleration
The deceleration and normalization is not exclusive to Clorox. Its peers Kimberly Clark (NYSE: KMB), Church and Dwight (NYSE: CHD), and Proctor and Gamble (NYSE: PG) show similar destruction in their shares and underlying businesses. Inflationary pressures have driven up materials, manufacturing, and logistics costs since the pandemic, all of which are eroding margins. Additionally, the tough macroeconomic headwinds weakening of consumer spending is causing migration to cheaper private label and generic cleaning product brands. Clorox recognizes the normalization after COVID and is prioritizing the rebuilding of margins and revenue growth of 3% to 5% implementing its Ignite strategy.
Leaner and Meaner
On Aug. 3, 2022, Clorox released its fiscal fourth-quarter 2022 results for the quarter ending June 2022. The Company reported a profit of $0.93 per share matching consensus analyst estimates for $0.93 per share. Revenues fell (-0.01%) year-over-year (YoY) to $1.8 billion missing consensus analyst estimates for $1.88 billion. Gross margins remained flat at 37.1% due to inflationary pressures in materials, manufacturing and freight costs. They were partially mitigates by its pricing and cost savings actions. A new streamlined operating model is set to launch in Q1 2023 and expected to generate $75 million to $100 million in annual ongoing savings. Selling and administrative expenses are targeted to fall to 13% of sales over time. Clorox CEO Linda Rendle commented, "The streamlined operating model we announced today to create a faster, simpler company is designed to increase efficiency, move decision-making closer to consumers and customers, and enable us to better meet their needs. This is another important step in implementing our IGNITE strategy of reimagining how we work, complementing the digital transformation initiative that's already underway.”
Downside Fiscal 2023 Outlook
Clorox issued downside guidance for full-year 2023 EPS between $3.85 to $4.22 versus $5.32 consensus analyst estimates. Revenue growth is expected to range from (-4%) to up 2% or $6.82 billion to $7.25 billion versus $7.34 billion analyst estimates. Gross margins are expected to rise 200 basis points as supply chain optimization, pricing increases and cost savings mitigate cost inflation. CEO Rendle expects the environment to remain “difficult” in fiscal 2023 but she remains committed to delivering 3% to 5% sales growth over the long-term.
The Charts Say…
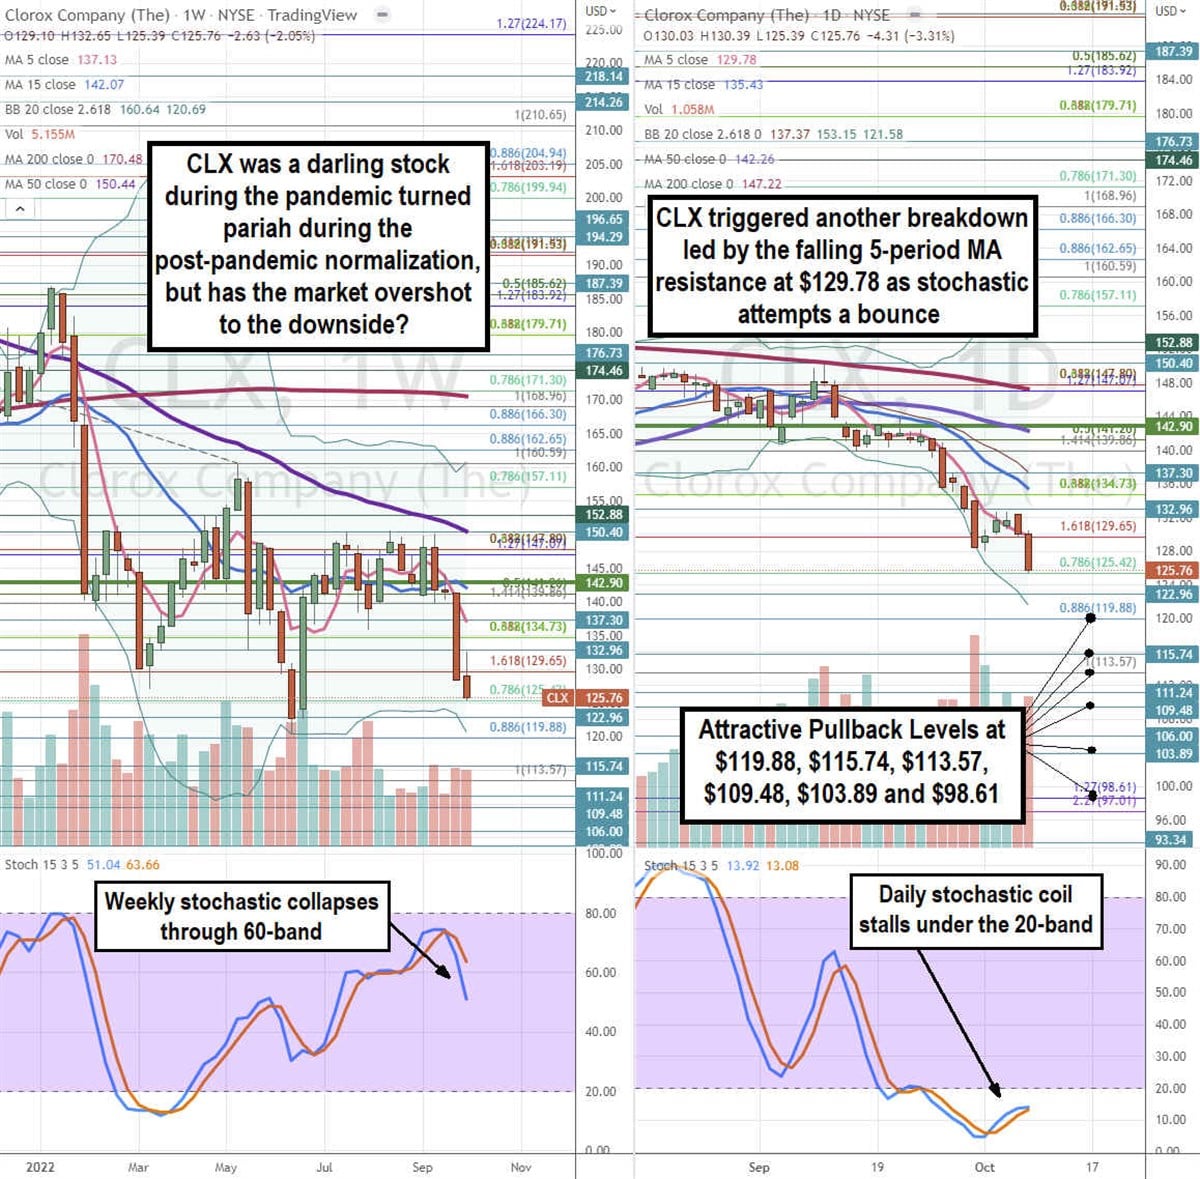
Using the rifle charts on weekly and daily charts can provide a near-term perspective of the playing field for CLX stock. The weekly rifle chart has a sharp breakdown led by the falling weekly 5-period moving average (MA) resistance at $137.13 followed by the 15-period MA resistance at $142.07. Shares triggered a breakdown after rejecting off the $160.59 Fibonacci (fib) level and cracking the weekly market structure low (MSL) buy trigger at $142.90. The weekly stochastic reversed back down through the 60-band. The daily rifle chart formed an inverse pup breakdown led by the falling daily 5-period MA resistance at $129.76 followed by the 15-period MA at $135.43. The daily 200-period MA and 50-peiod MA resistances are falling at $147.22 and $142.46, respectively. The daily lower Bollinger Bands (BBs) sit at $121.58 as the daily stochastic stalls just above the 10-band. Keep an eye on the charts for peers PG, KMB, and CHD as they have similar formation and a bottom for one can mean a bottom for the whole group. Attractive pullback levels sit at the $119.88 fib, $115.74, $113.57 fib and 2018 lows, $109.48, $103.89, and the $98.61 fib level.


