
Amazon.com, Inc. (AMZN) recently said it will invest up to $4 billion in cash in the high-profile startup Anthropic in its effort to compete with growing cloud rivals on artificial intelligence.
Also, Amazon Web Services, Inc. (AWS) announced five generative artificial intelligence (AI) innovations, aiming to power organizations with new generative AI applications, enhanced employee productivity, and help transform businesses. The company is ramping up its generative AI plans to capitalize on the opportunities that the latest generation of technology is set to fuel.
Moreover, AMZN is in talks as the holiday shopping season kicks in. However, while consumer spending has proved resilient and inflation has eased significantly, Americans tend to be still forgoing discretionary categories.
On the other hand, AMZN is facing an array of antitrust lawsuits. The U.K. Competitions and Markets Authority launched an investigation into cloud services and whether big providers like Amazon make it difficult for businesses to switch or use more than one provider.
Adding to the legal pressure, the U.S Federal Trade Commission has launched an antitrust lawsuit against Amazon, alleging monopolistic practices and misuse of power.
These recent headlines could precipitate noticeable volatility in the company's stock in the near term, suggesting it may not be the most opportune moment to acquire Amazon shares. Therefore, a comprehensive analysis of the company's key metrics is advised.
Amazon.com Inc.'s Financial Performance: A Detailed Review of Trends and Fluctuations (2020-2023)
The trailing-12-month net income of AMZN has exhibited both an upward and downward trajectory with significant fluctuations over the period.
- Starting from December 31, 2020, the Net Income rose from $21.33 billion to a peak of $33.36 billion on December 31, 2021. This signifies a growth rate of approximately 56.51% within that period.
- The first quarter of 2022 marked the start of a decreasing trend, bringing the Net Income to $11.32 billion by the end of September 2022.
- A notable dip occurred in the last quarter of 2022, where Net Income reported a loss of -$2.72 billion.
- 2023 began with a moderate recovery to $4.29 billion in the first quarter and registered $13.07 billion at the end of the second quarter.
The latest value on record, as of June 30, 2023, is $13.07 billion, which, despite the abovementioned fluctuations, represents a decrease of around 38.84% compared to the initial value in this series on December 31, 2020. This is indicative of an overall declining trend when taking into consideration the entirety of the specified period. The data points to drastic periodical fluctuations in AMZN's net income, highlighting the necessity for continuous analysis to understand ongoing trends.

- On December 31, 2020, AMZN had a ROA of 0.079 or 7.9%.
- The ROA slightly increased in the first half of 2021, reaching 0.092 (9.2%) by June 30, 2021. It then dipped to 0.076 (7.6%) by September 30, 2021, and rebounded at year-end to 0.09 (9.0%).
- In the first quarter of 2022, there was a notable drop in ROA to 0.054 (5.4%), with a decline continuing through to the third quarter to reach 0.027 (2.7%) by September 30, 2022.
- A notable downturn occurred at the end of 2022 with a recorded negative ROA of -0.006 (-0.6%) on December 31, which hints at a loss within the company's operations for that period.
- In the first half of 2023, there is a gradual increase from 0.01 (1.0%) in the first quarter to 0.029 (2.9%) by the end of the second quarter. This indicates a recovery from the previous year's negative overview.
From the data, we can see a general upwards trend in Amazon.com Inc.'s ROA between December 2020 and June 2021, followed by a marked decrease leading to a negative ROA by the end of 2022. The first half of 2023 suggests some recovery. Calculating the growth rate from the first value (7.9% in December 2020) to the last value (2.9% in June 2023), there is an overall decline in the ROA of 63.29%.

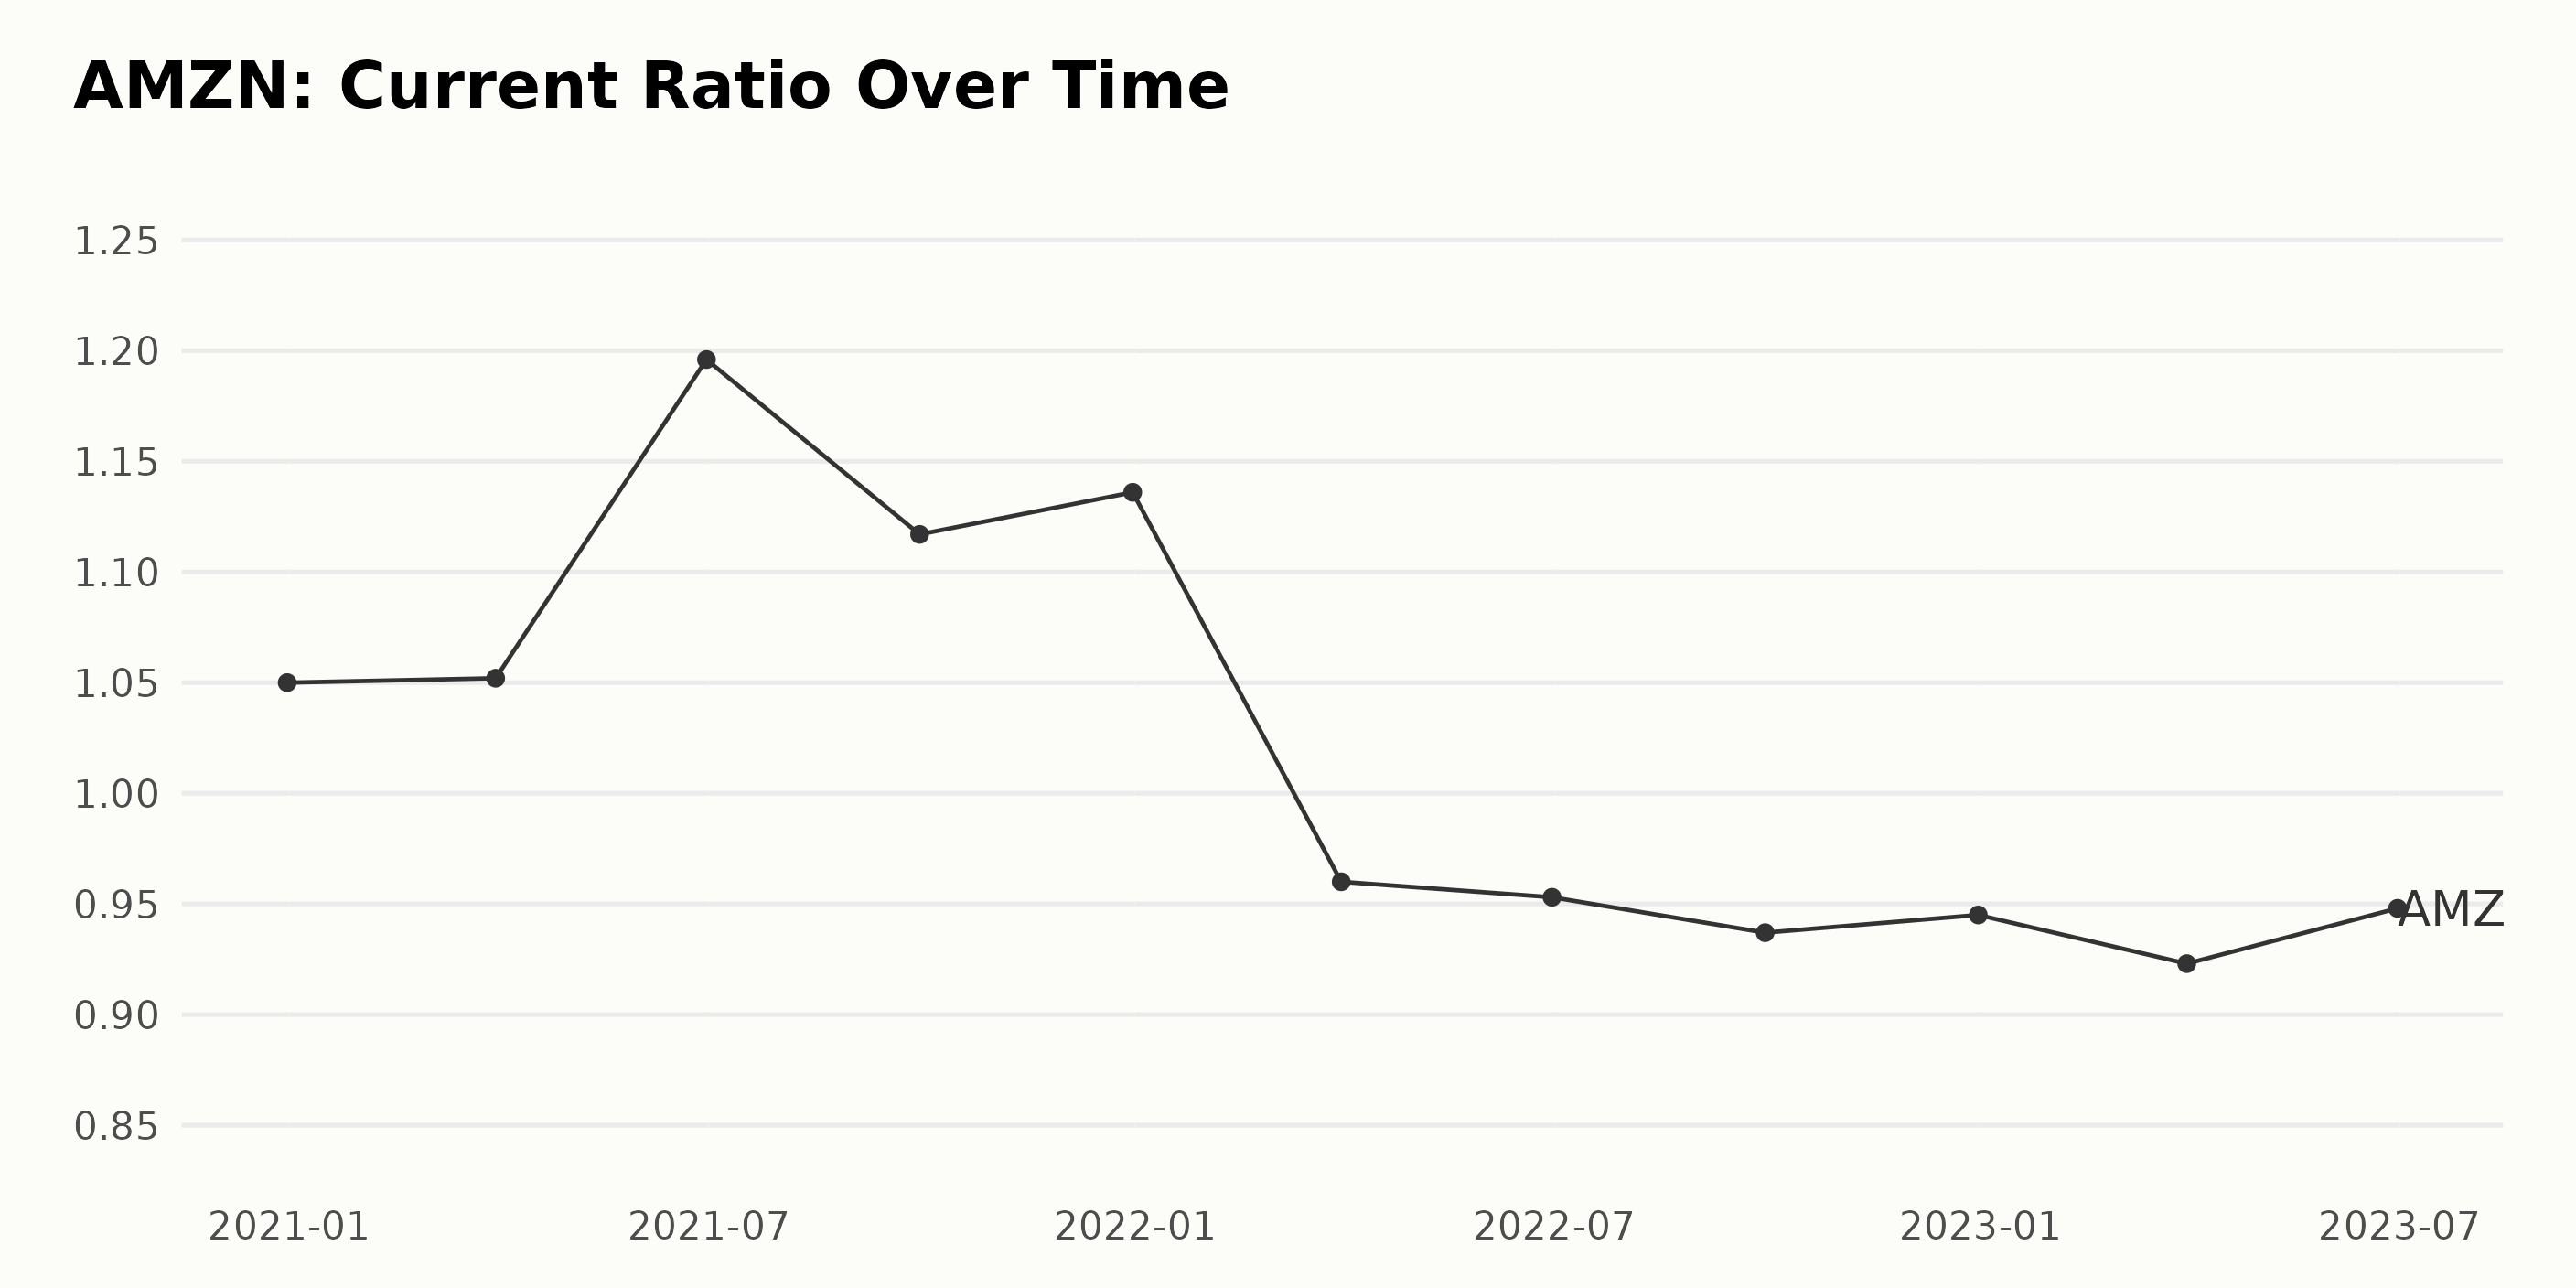
Here is a summarised view of the trend and fluctuations in the Current Ratio of AMZN from December 2020 to June 2023.
- As of December 2020, the Current Ratio for Amazon was 1.05.
- There was a slight increase to 1.052 at the end of March 2021.
- A more substantial growth was seen by the end of June 2021, when the Current Ratio reached its peak of 1.196.
- The ratio then experienced a decline down to 1.117 by September 2021 and ended the year at 1.136 in December 2021.
- Beginning in 2022, the Current Ratio dropped significantly below 1.0, starting with 0.96 in March and ending with 0.945 in December.
- The first quarter of 2023 marked the lowest record with a Current Ratio of 0.923 before seeing a small recovery to 0.948 by the end of June 2023.
Over this two-and-a-half-year period, the Current Ratio of Amazon has shown significant fluctuations, peaking in mid-2021 before decelerating to below unity from 2022 onwards. Analyzing the growth rate measured from the first value in December 2020 (1.05) to the last in June 2023 (0.948), we observe an effective decrease of approximately -9.71%. The emphasis on more recent data highlights a noticeable declining trend since late 2021, indicating Amazon's inability to cover its short-term liabilities with its short-term assets.
The reported Asset Turnover of AMZN has been experiencing a trend of decreasing from the end of year 2020 to mid-year 2023. To break down,
- At the end of 2020, the Asset Turnover was 1.43.
- This figure slightly decreased to 1.41 at the end of March 2021.
- By the end of June 2021, it was down to about 1.38, then dropped again to 1.32 by September 2021.
- In December 2021, it fell further to about 1.26, and by the end of March 2022, it was 1.21.
- A small decline occurred in June 2022, with the figure being 1.19.
- There was a slight increase to approximately 1.20 in September 2022, but decreased again to 1.19 in December 2022.
- Finally, the asset turnover value as of the end June 2023 stands at 1.17, representing a continued decrease.
As seen from the series data, AMZN's Asset Turnover is experiencing a general decline from 1.43 at the end of 2020 to about 1.17 by June 2023. This implies that the frequency of AMZN's assets' turnover is gradually slowing. The difference between the initial Asset Turnover of 1.43 and the last recorded Asset Turnover of 1.17 indicates a negative growth rate of approximately 18% across this period. Therefore, with an emphasis on more recent data, the Asset Turnover of Amazon.com Inc. shows a declining trend.

The provided data series reflects the reported Analyst Price Target for AMZN. Here's a summary of the data trends and fluctuations:
- From November 2021 to January 2022, the Analyst Price Target remained constant at $4,000.
- In January 2022, there was a minor increase, and the target reached $4,050.
- There was a moderate increase until February 2022 when the target hit $4,100.
- There was a steady rise until mid-March, where the target spiked to $4,125 before declining back to $4,100.
- In May 2022, the target began a sharp decline from $4,100 to $1,830 in June.
- The target plummeted to an all-time low of $175 by July 2022 after a dramatic fall in June.
- Since that dramatic fall, the target remained flat until November 2022 when it further declined to $140.
- The target remained at $140 till January 2023 before slightly decreasing to $135, which remained constant until May 2023, showing little fluctuation.
- Between May and July 2023, a gradual increase was observed, with the target reaching $144.
- By August 2023, following a significant increase, the target finally reached $170.
- The last recorded value on October 9, 2023, indicated a slight increase to $172.
The growth rate calculated from the first recorded value ($4,000 in November 2021) to the last ($172 in October 2023) demonstrates a severe decline of approximately 95.7%. The most recent data indicates a persistently low analyst price target. What led to the unprecedented decline in mid-2022 will require more detailed analysis and context. However, since reaching its low point, there appears to be a slight upward trend starting from May 2023.

Analyzing Amazon.com Inc.'s Share Price Trends: April - October 2023
Below is the trend and growth rate of AMZN based on its weekly share prices from April to October 2023:
- On April 14, 2023, the share price was $100.76.
- It showed a gradual increase in value over the next two weeks, reaching $106.57 by April 28.
- Although it experienced a slight dip to $104.04 on May 5, the price steadily climbed to $122.30 by June 2, indicating a strong upward trend.
- The trend continued with minor fluctuations into July and August, reaching a peak of $139.23 on August 11.
- From mid-August till the end of September, the growth rate decelerated, with the price dropping to $127.18 on September 29.
- However, the price showed signs of recovery from late September, ending at $126.66 on October 6, 2023.
In summary, AMZN overall saw an increasing trend in their share prices from April 14, 2023, to October 6, 2023. There was a consistent upward movement till the first half of August, followed by a period of deceleration. This decelerating trend seems to stabilize towards the end of the given date range. Here is a chart of AMZN's price over the past 180 days.

Amazon's Ascending POWR Ratings: Diving into Sentiment, Quality, and Growth
AMZN has an overall C rating, translating to a Neutral in our POWR Ratings system. It is ranked #19 out of the 57 stocks in the Internet category.
Based on the POWR Ratings for AMZN, the three most noteworthy dimensions are Sentiment, Quality, and Growth. These dimensions consistently present high ratings across the referenced time period that extends from April 2023 to October 2023.
Sentiment
The Sentiment dimension manifests a clear trend of upward movement. This dimension sees its ratings consistently increasing from the score of 49 in April 2023 to the peak rating of 99 in June, August, and September 2023. Even though the Sentiment shows a slight decrease to 82 by October 2023, the overall positive trajectory reflects promising investor sentiment towards AMZN during this period.
Quality
The Quality dimension presents strong ratings for AMZN throughout the reported period as well. The ranking sees some fluctuations - it begins at 82 in April 2023, drops slightly to 79 in May 2023, and sustains this score till July 2023. However, it then jumps to reach its highest of 85 in August 2023, maintaining this high score in September and October 2023.
Growth
As for the Growth dimension, although it experiences a few oscillations, the ratings remain solid, signifying robust growth potential for the company. The Growth dimension starts out relatively high at 81 in April 2023, escalates to the peak of 87 in May 2023, and subsequently falls to 75 in August 2023. Despite this decline, the ratings recuperate slightly and stabilize around the mid-70s towards the end of the reporting timeframe in September and October 2023.
In summary, these three dimensions - Sentiment, Quality, and Growth - contribute significantly towards shaping the POWR Ratings for AMZN, indicating a generally favorable position for the company in these areas over this reported period.

How does Amazon.com Inc. (AMZN) Stack Up Against its Peers?
Other stocks in the Internet sector that may be worth considering are LINE Corporation (LN), Yelp Inc. (YELP), and Travelzoo (TZOO) -- they have better POWR Ratings.
What To Do Next?
43 year investment veteran, Steve Reitmeister, has just released his 2024 market outlook along with trading plan and top 11 picks for the year ahead.
AMZN shares were trading at $127.53 per share on Monday afternoon, down $0.43 (-0.34%). Year-to-date, AMZN has gained 51.82%, versus a 13.76% rise in the benchmark S&P 500 index during the same period.
About the Author: Subhasree Kar

Subhasree’s keen interest in financial instruments led her to pursue a career as an investment analyst. After earning a Master’s degree in Economics, she gained knowledge of equity research and portfolio management at Finlatics.
The post Analyzing Amazon.com (AMZN): This Weeks Insights for Investors appeared first on StockNews.com