
Meta Platforms Inc. (META) posted better-than-expected second-quarter results. The use of AI in advertising and various product refinements were the key drivers of this impressive performance.
Reflecting a robust comeback from recent challenges, the company reported double-digit growth for the quarter, the first time since the end of 2021.
On August 24, META unveiled its advanced Large Language Model (LLM), Code Llama. The revolutionary tool is anticipated to reform developer working practices by generating and engaging in code dialogues prompted by text input.
The company plans to leverage its newest device, Meta Quest 3, scheduled for release later this year. The enhanced virtual reality and mixed-reality headset introduce a superior resolution, improved performance, and state-of-the-art Meta Reality technology, combined elegantly in a user-centric design focusing on aesthetics and comfort.
Strong user engagement and a promising trajectory are expected to be the underlying factors for the company’s success. The trends of some of META’s key financial metrics discussed here reveal why there are plenty of upsides left in the stock:
Analysis of META's Financial Performance: Trends and Fluctuations (2020-2023)
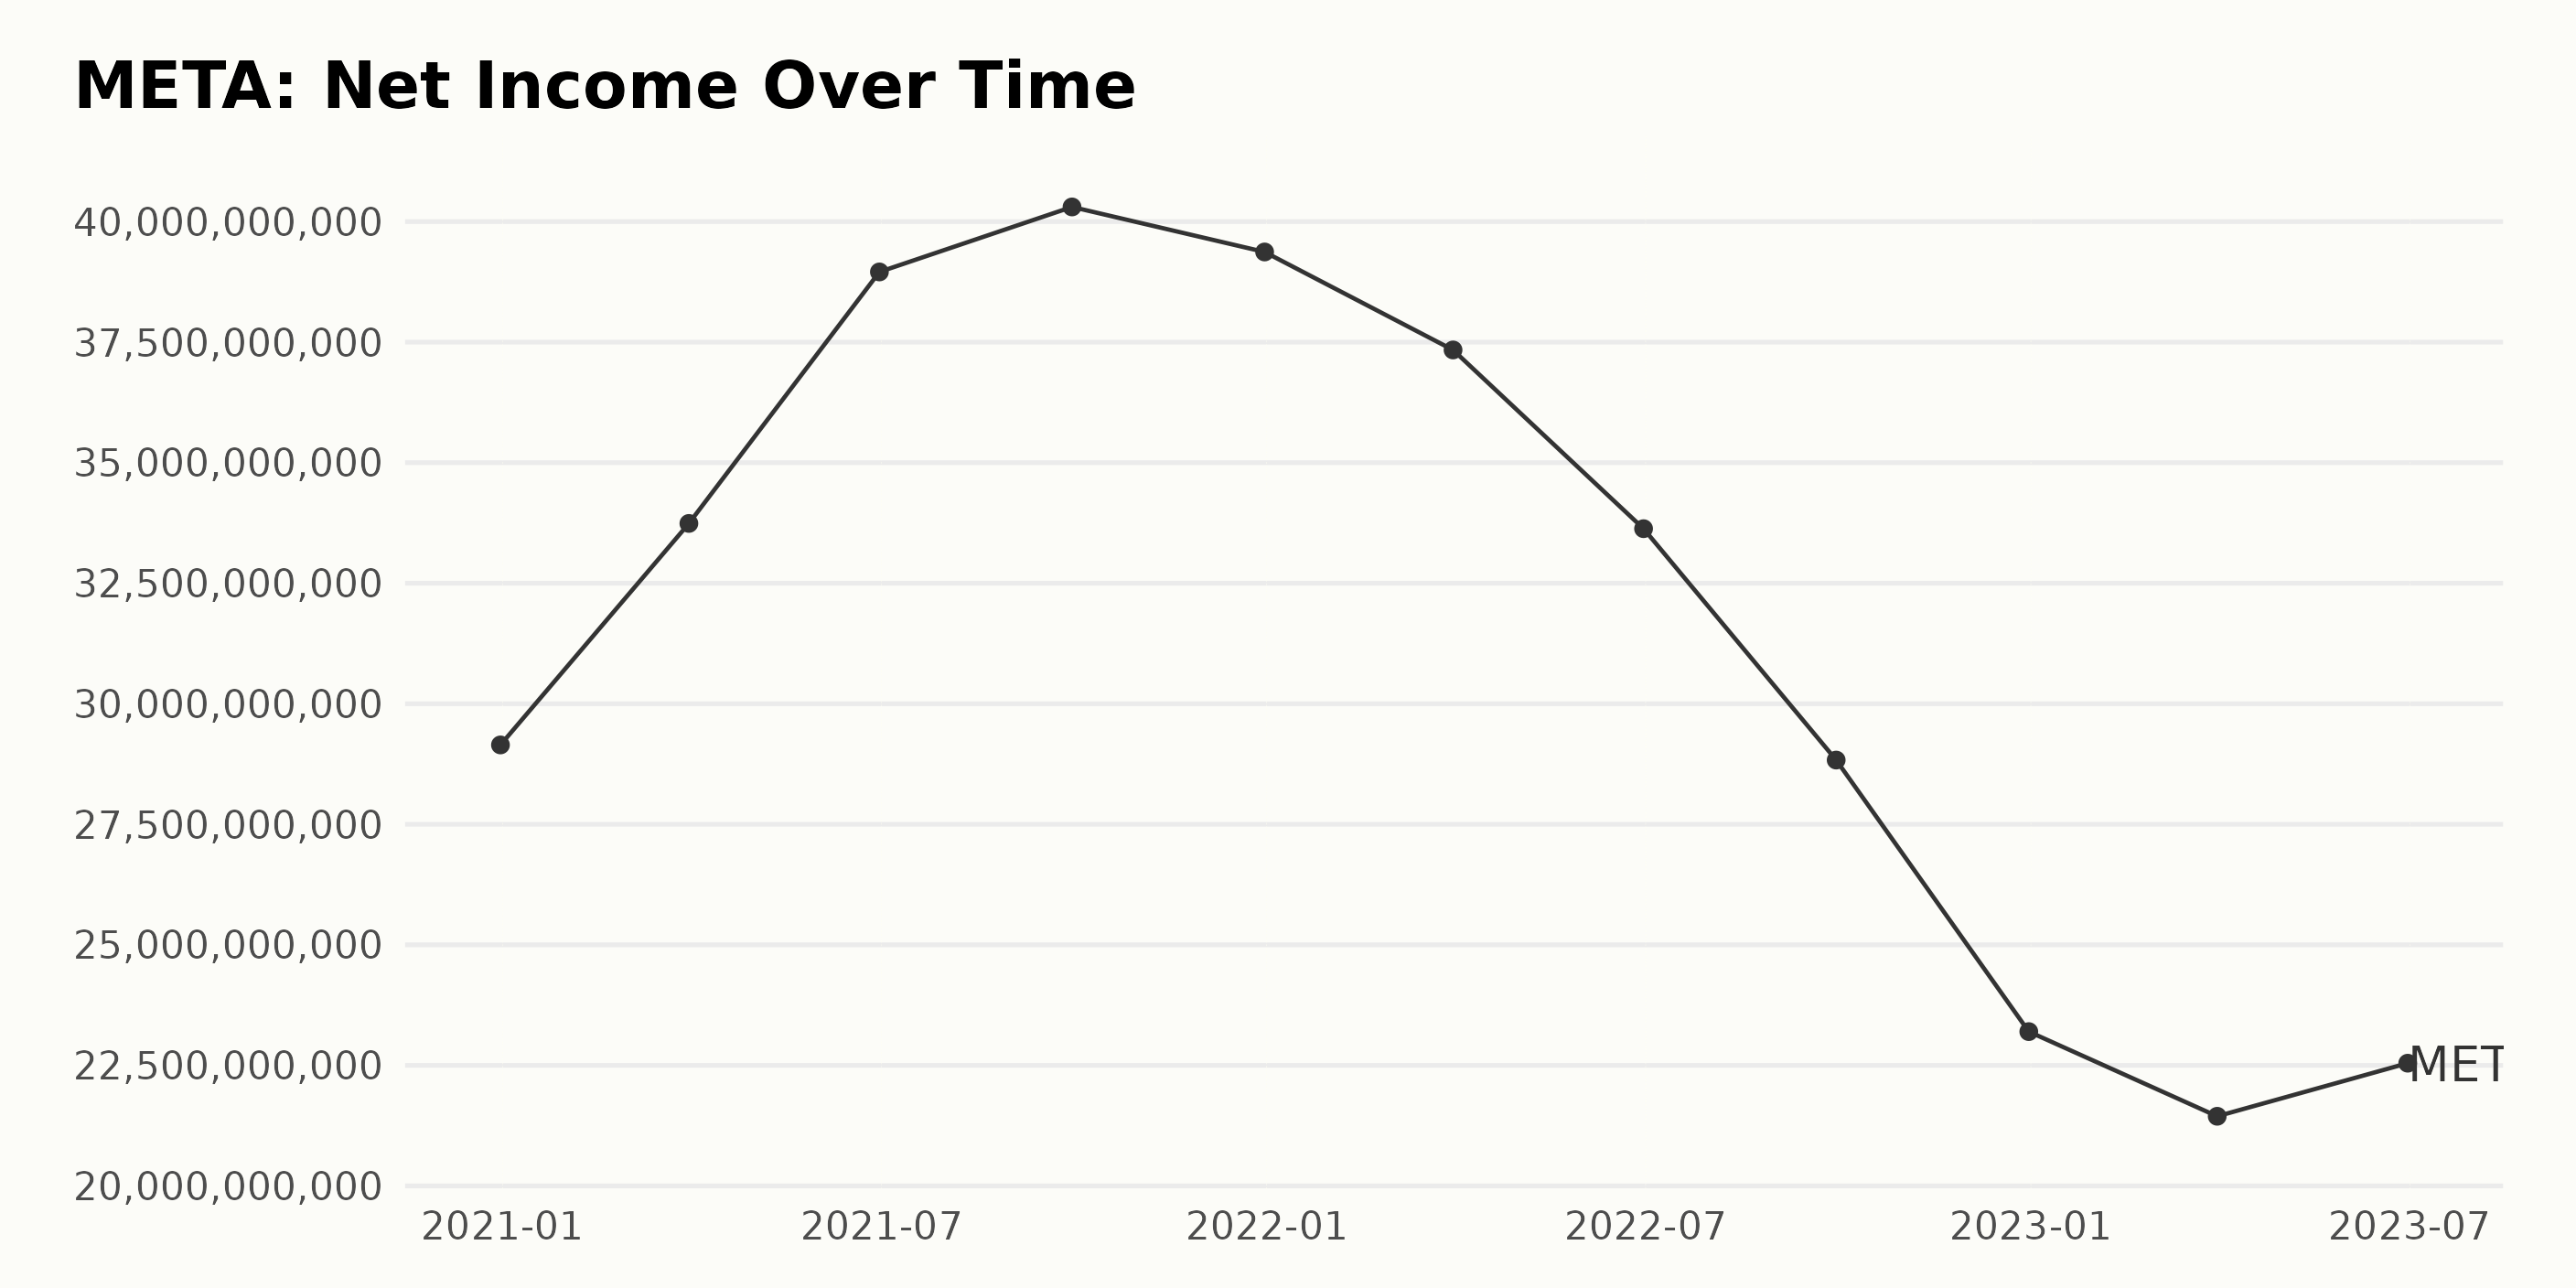
Here is the trend in META’s net income:
· On December 31, 2020, META's net income was $29.15 billion.
· There was a sharp increase over the subsequent quarters, reaching a peak by the third quarter of 2021 with a net income of $40.30 billion on September 30, 2021.
· However, from the fourth quarter of 2021 until the first quarter of 2023, META's net income showed a downward trend overall.
· The lowest point of this decline happened on March 31, 2023, with net income standing at $21.44 billion.
· The most recent data indicates a slight recovery in the second quarter of 2023, with net income rising to $22.55 billion on June 30, 2023. Considering the first value ($29.15 billion on December 31, 2020) and the last value ($22.55 billion on June 30, 2023), the company witnessed a negative growth of approximately 23%.
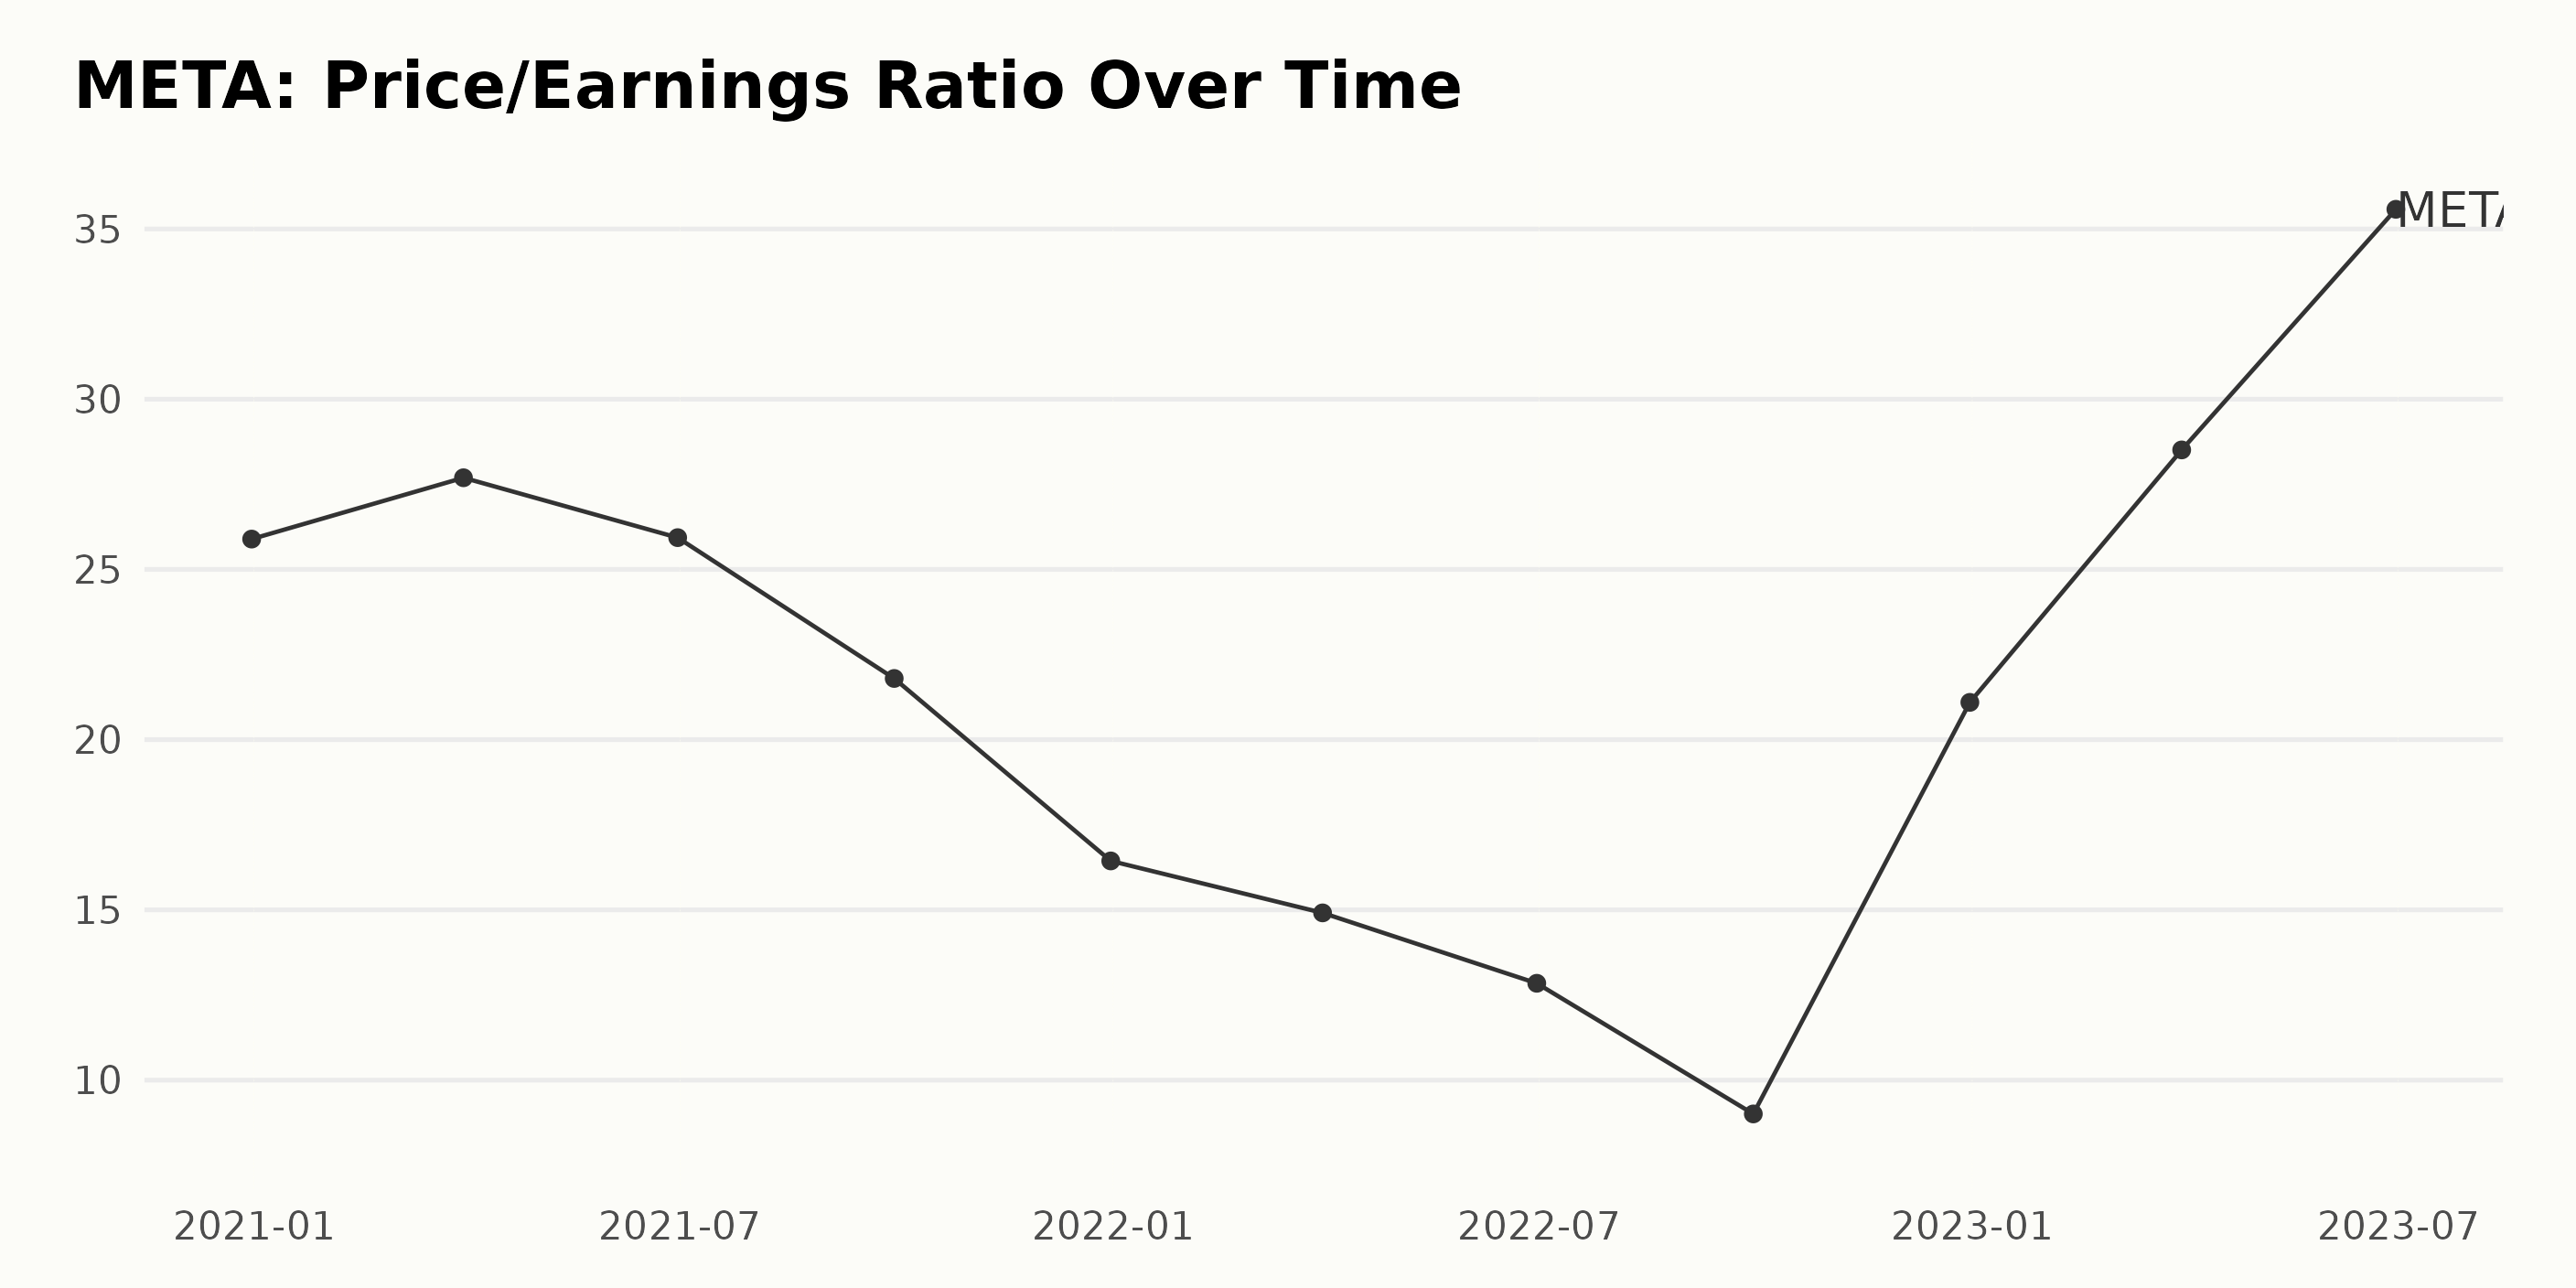
The trend in META's Price/Earnings (PE) ratio from December 2020 to June 2023 is summarized below:
· In December 2020, the PE ratio began at 25.89.
· This grew moderately in the first quarter of 2021 to 27.69 but then dropped back to a similar year-start position by the end of June 2021 at 25.93.
· A notable downward trend was observed starting in September 2021, with the PE ratio falling to 21.80, signaling a potential undervaluation of the META shares.
· This downward trend steepened further through the next three quarters, hitting an all-time low of 9.01 by the end of September 2022.
· However, a sudden reverse movement was recorded starting from December 2022, with the PE ratio rebounding to 21.10.
· This upward trend continued into the first half of 2023, where the PE ratio reached 28.51 and 35.58 for March and June, respectively.
If we look specifically at the growth rate from the first to the last value in this series, there was an overall increase of approximately 37%, indicating a net positive valuation change for META over the observed period.
Please note that while the data shows fluctuating highs and lows, more emphasis should be placed on recent trends and the last value of the series, indicating that META's PE ratio is currently experiencing an increasing trend.
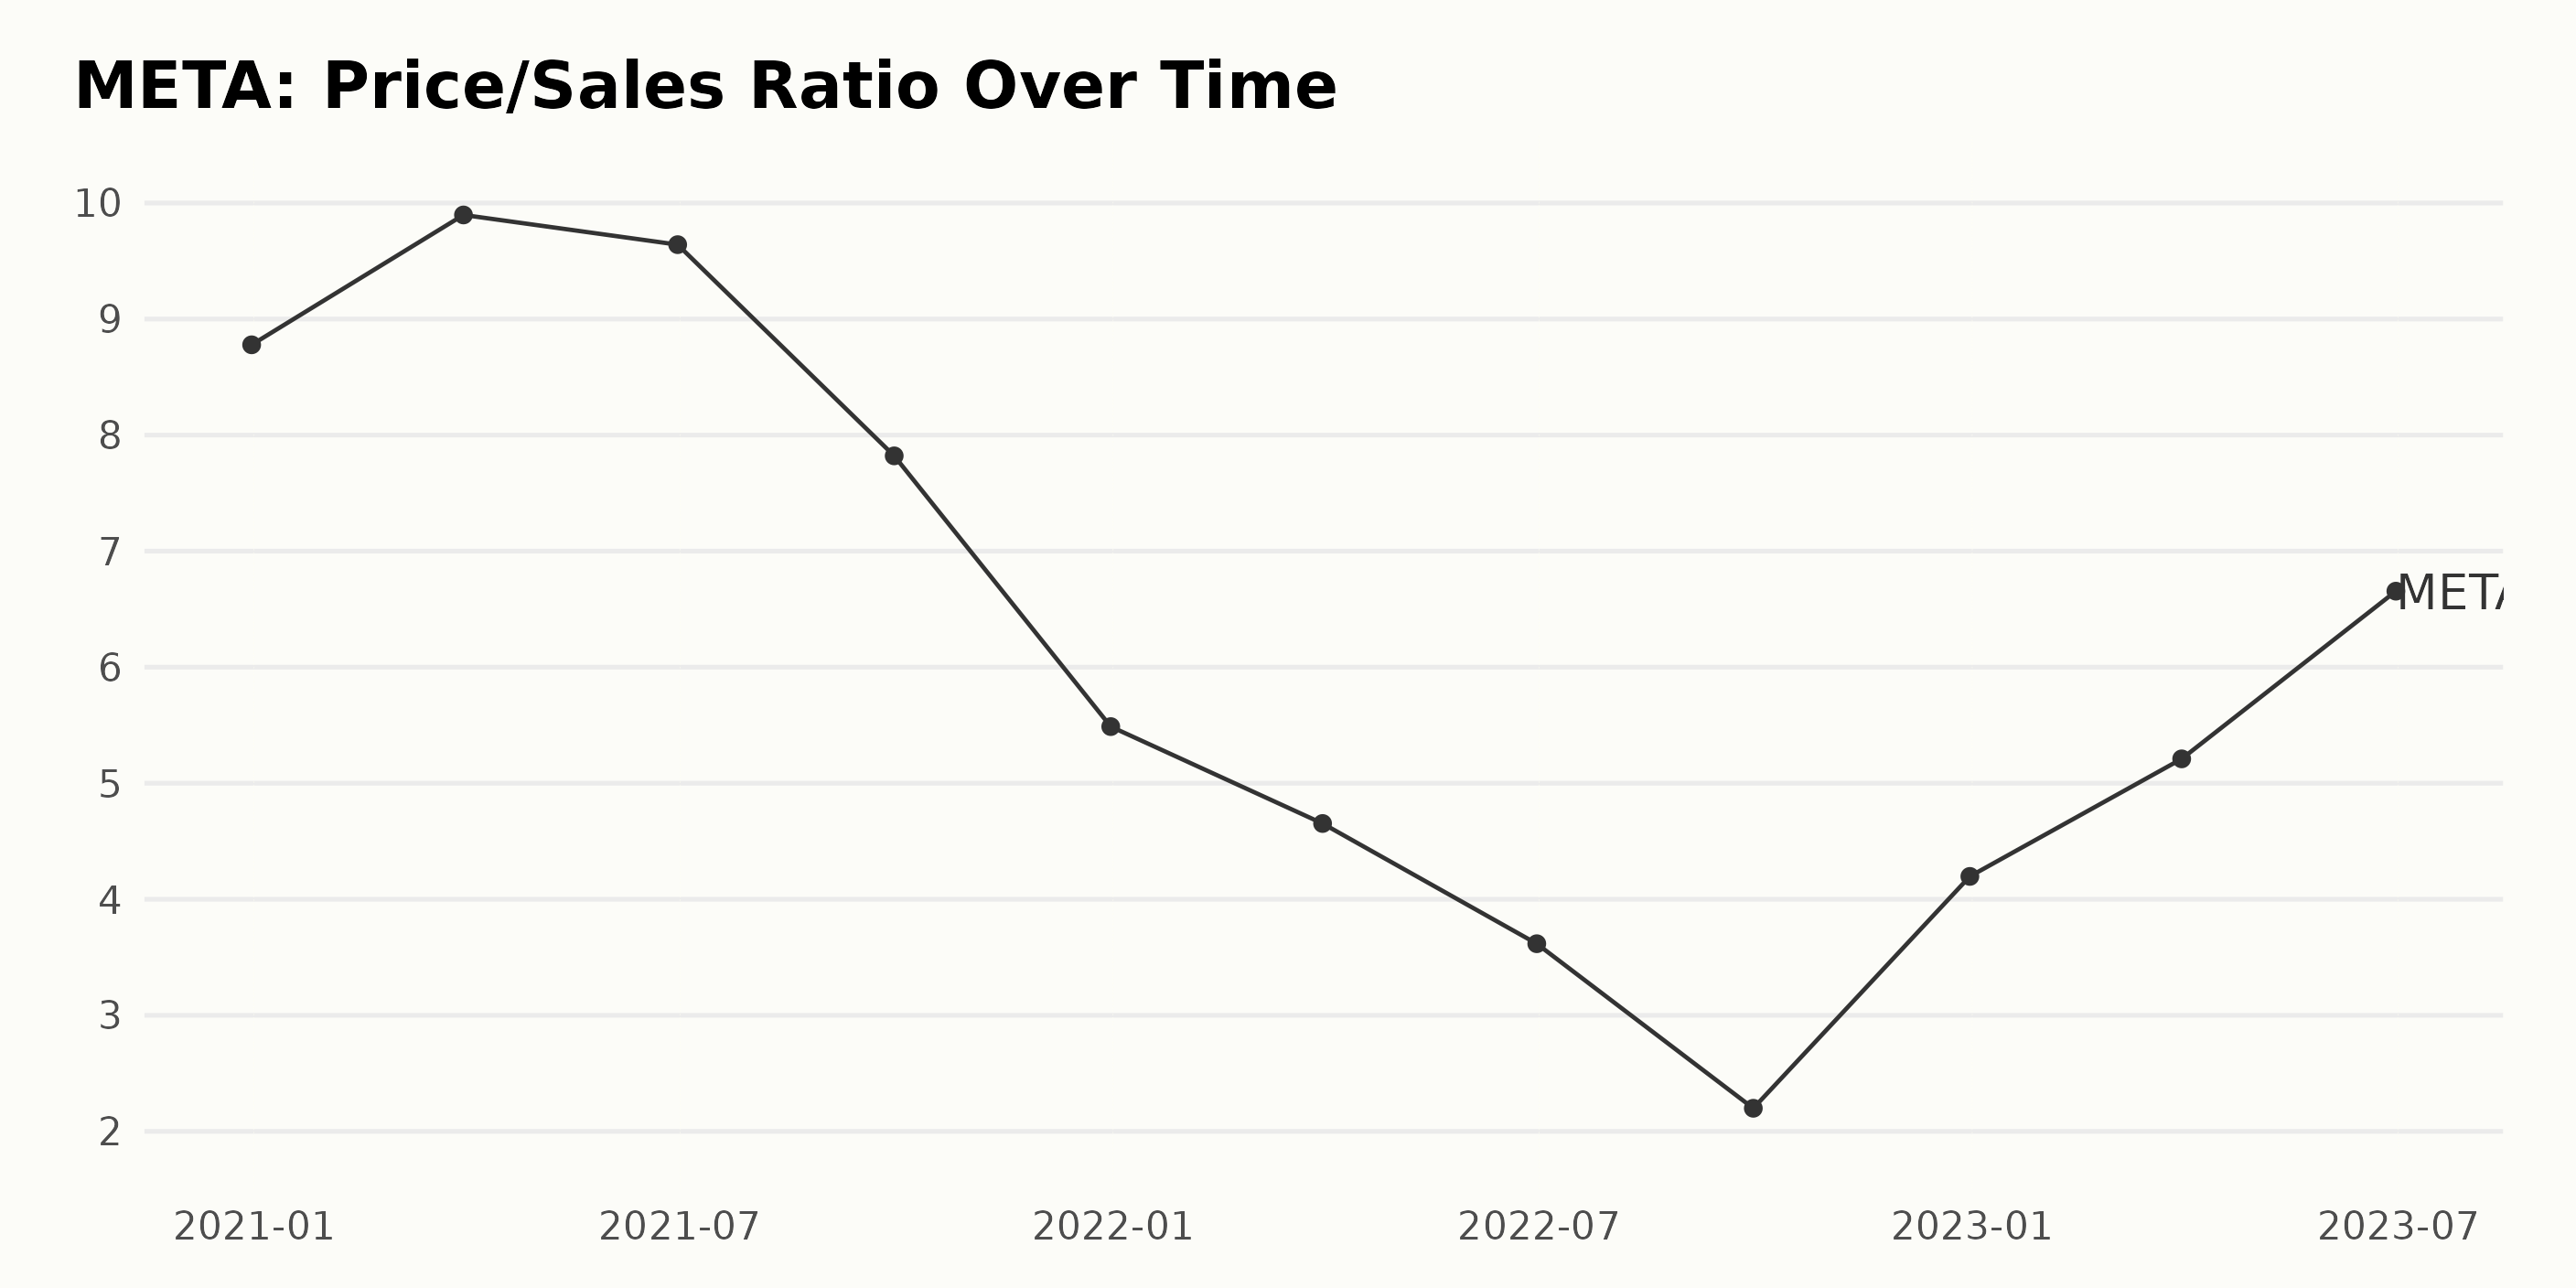
META’s Price/Sales ratio (PS) has been experiencing significant fluctuations over the observed period, with a predominant downward trend since December 2020 before picking up again in 2023.
· On December 31, 2020, the Price/Sales ratio started at around 8.78.
· The PS increased to 9.90 by March 31, 2021, and dipped slightly to 9.64 on June 30, 2021.
· A significant decrease was observed towards the end of 2021, standing at 7.82 and 5.49 on September 30 and December 31, respectively.
· Throughout 2022, the decline continued further, dropping to 4.65 in March, then 3.62 in June, and reaching a low of 2.2 by September 30, 2022. However, the value bounced back to 4.20 on December 31, 2022.
· In the first half of 2023, META recovered its PS ratio, increasing to 5.21 and 6.66 by March 31 and June 30, respectively. The growth rate calculated from the first value (8.778 on December 31, 2020) to the last value (6.655 on June 30, 2023) presents a decrease of approximately 24%. This indicates a negative overall rate of change in the long-term perspective despite recent rebounds. The most recent data emphasizes that META improved its Price/Sales ratio in the first half of 2023 after a considerable decline throughout 2021 and 2022.
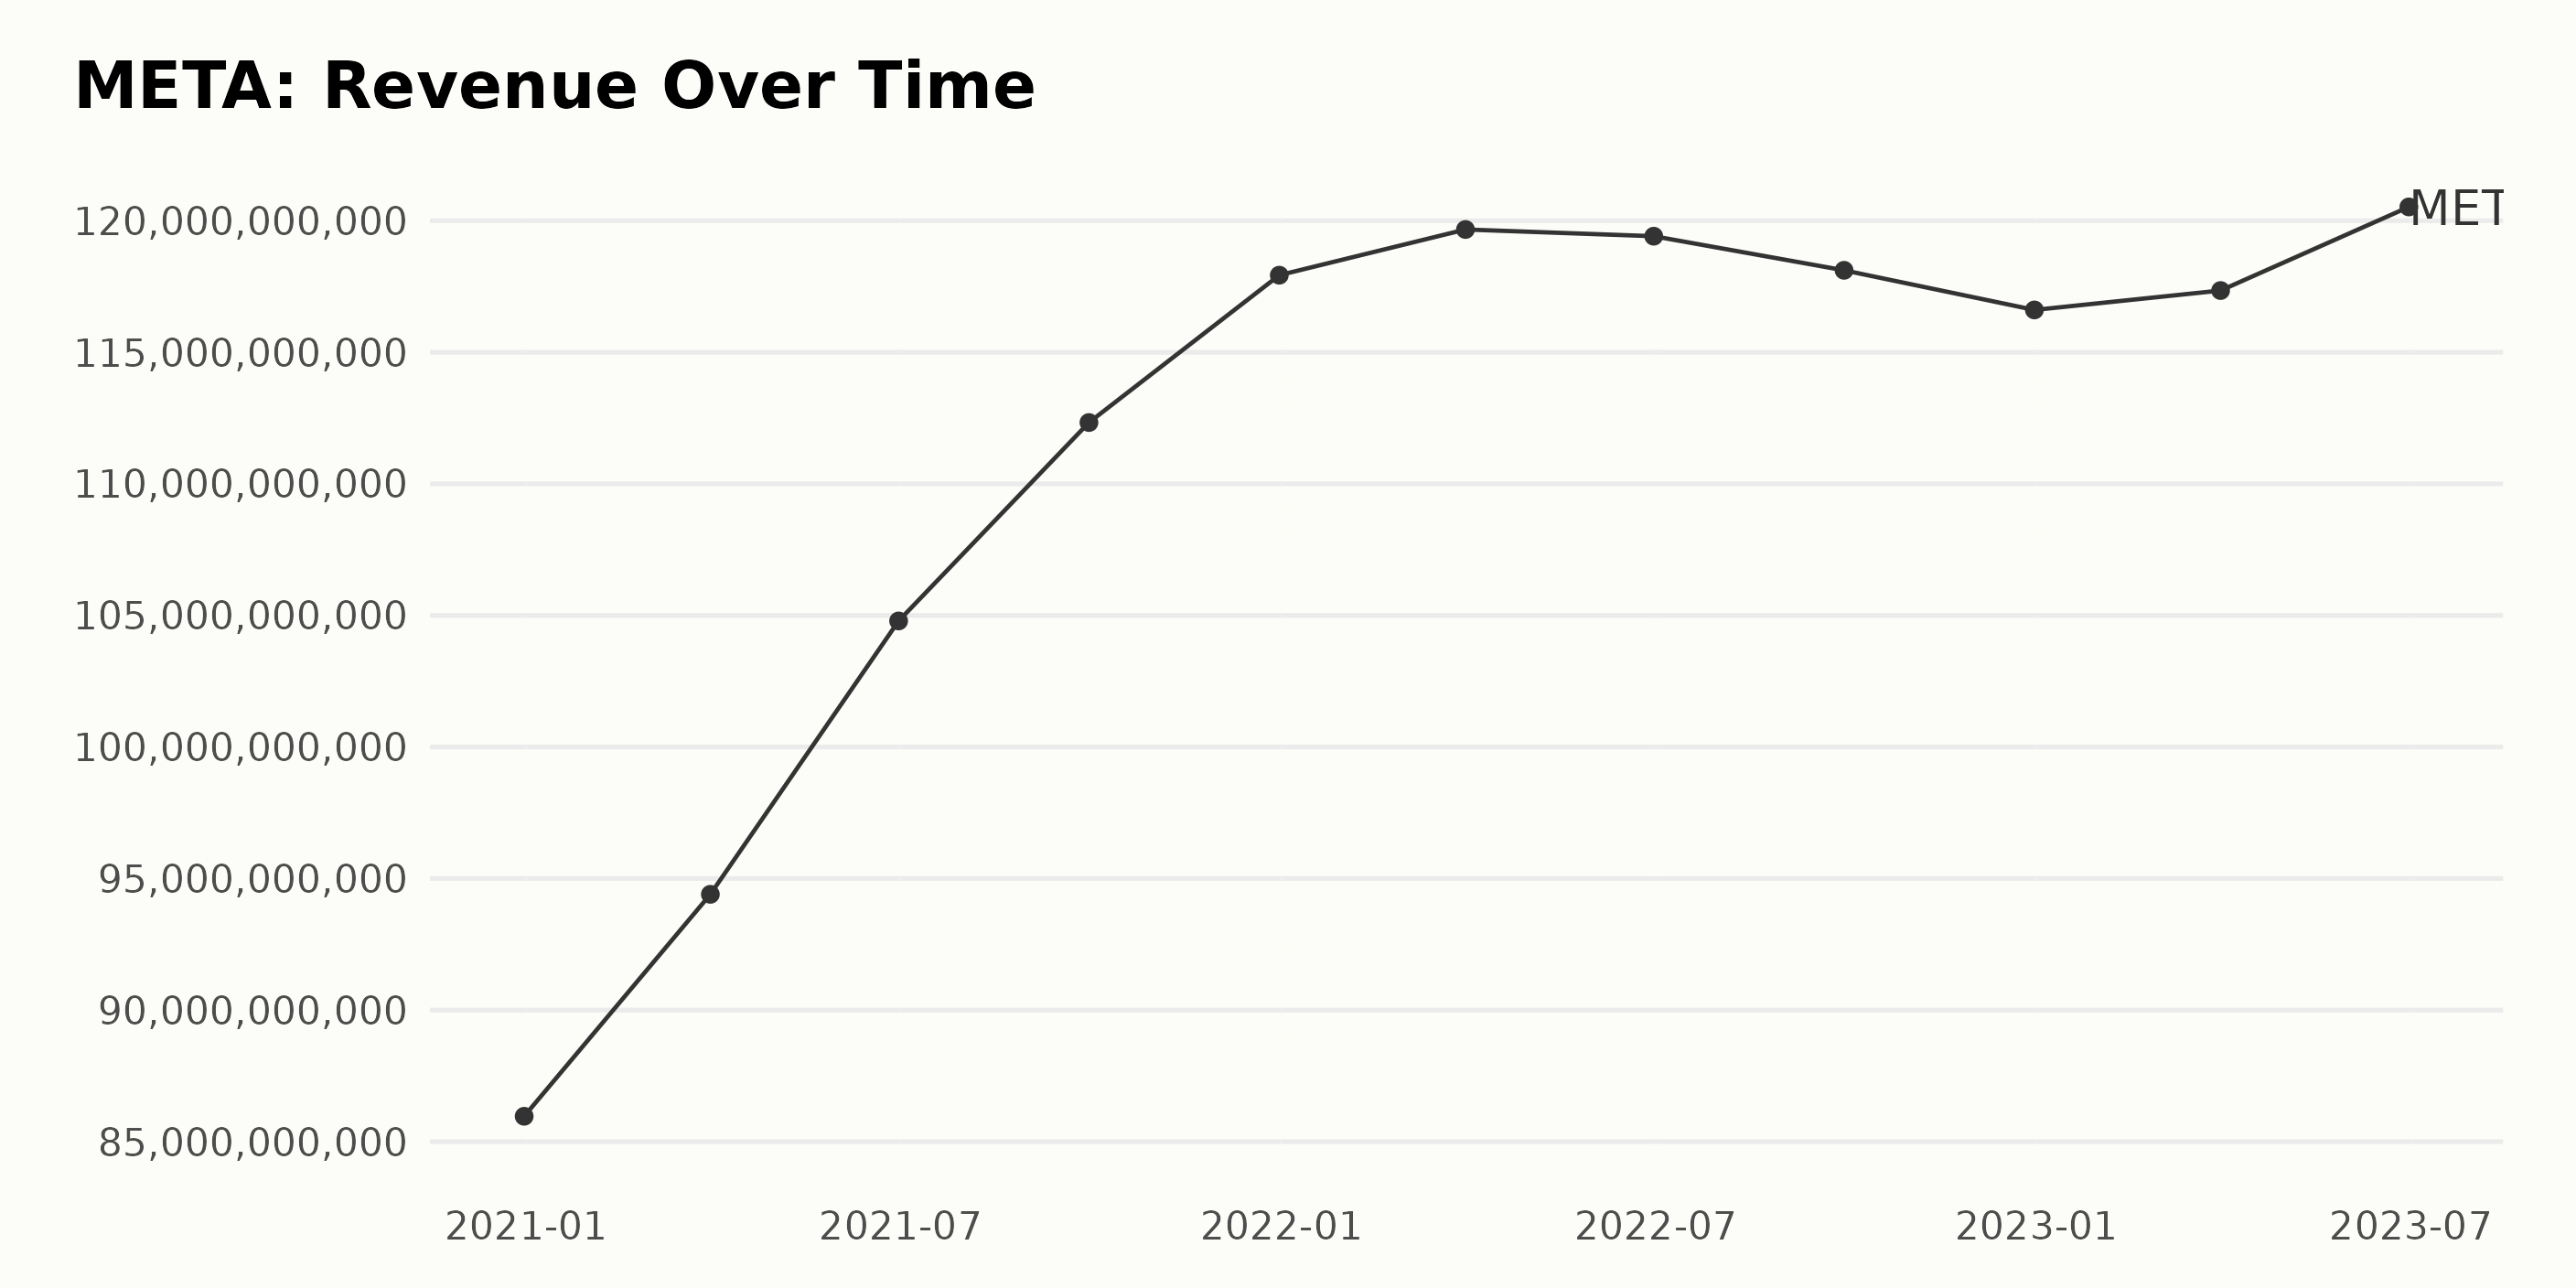
META’s revenue depicted a significant growth trend from December 2020 to June 2023, barring some fluctuations.
· Starting from $85.97 billion in December 2020, META's revenue exhibited a notable increase each quarter, peaking at $119.67 billion by March 2022.
· A slight dip occurred following this peak, with revenue dropping to $118.12 billion in September 2022 and further declining to $116.61 billion by the end of the year.
· However, the downtrend did not persist long-term, with a subsequent rise observed in the first half of 2023. By June 2023, the revenue had recovered to an impressive $120.52 billion.
Calculating the growth rate from the first value to the last, there is a remarkable increase of 40.2%. This shows that despite some fluctuations in the short term, the overarching trend for META's revenue over time is positive, depicting a solid growth performance. More recent data (in 2023) suggests a promising upward trajectory, displaying the company's ability to bounce back from previous revenue dips.
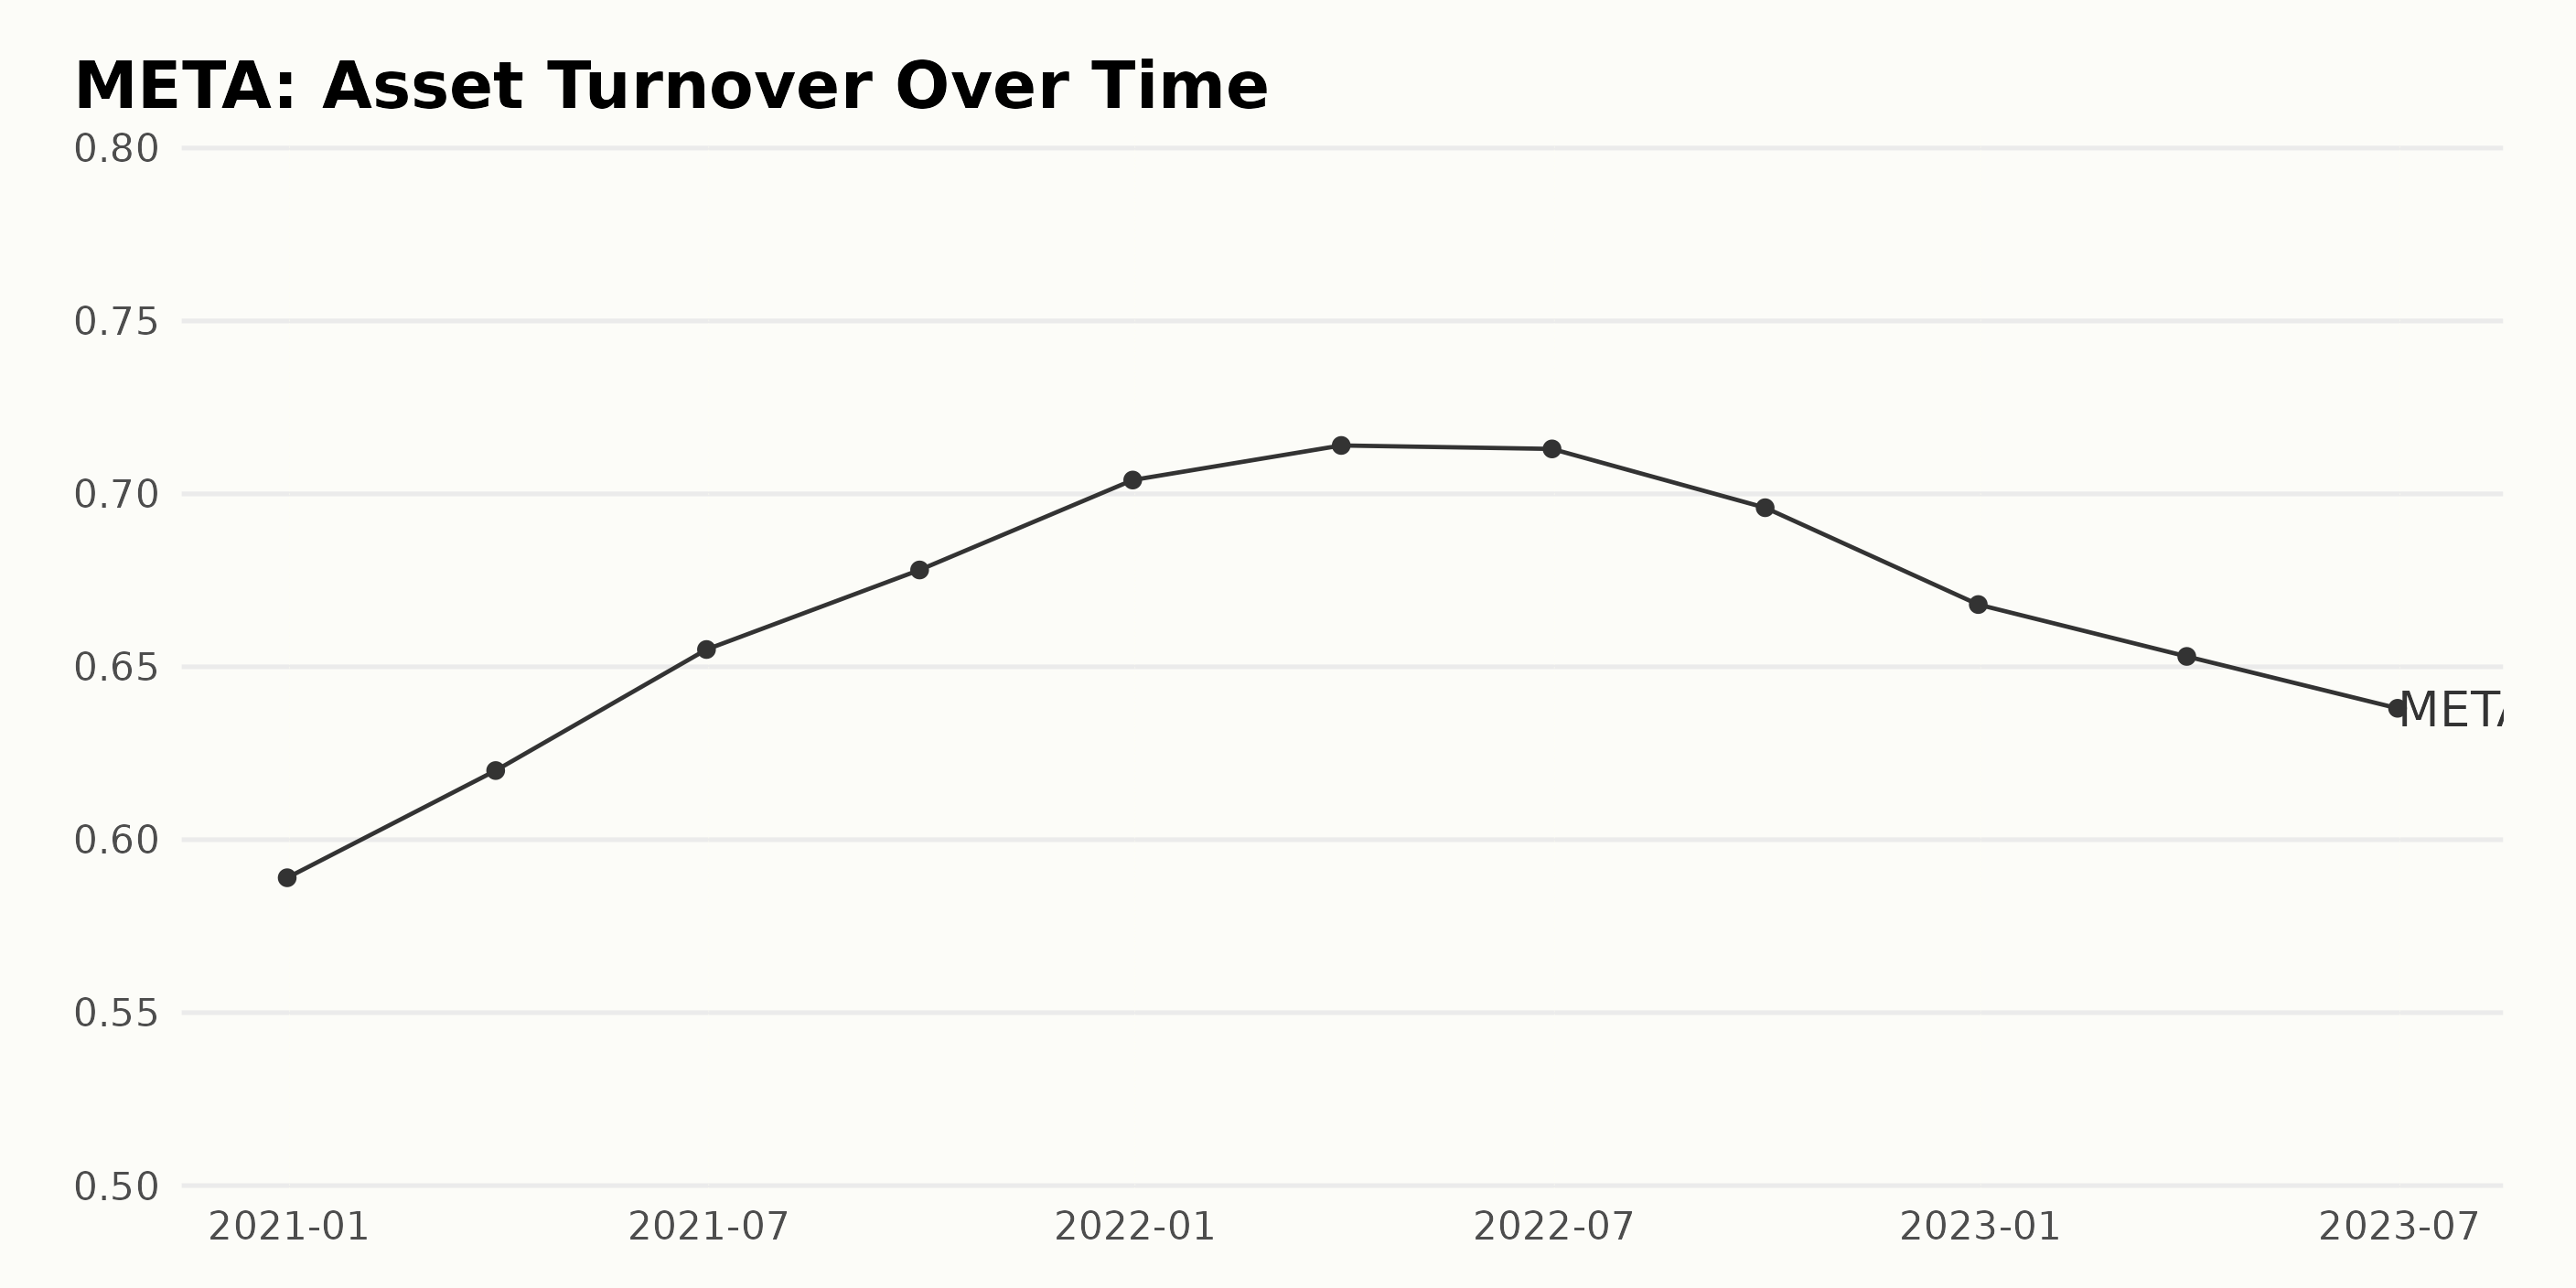
The trend and significant fluctuations in the asset turnover of META within the past three years are as follows:
· Starting from December 2020, META started with an asset turnover of 0.59.
· Throughout 2021, there was a gradual increase in asset turnover. This trend started on March 31, 2021, with the asset turnover being 0.62, which further rose to 0.68 by September 30, 2021.
· By December 31, 2021, a peak rise was noted at 0.70.
· In the first quarter of 2022, the highest asset turnover value was observed on March 31, climbing to 0.71.
· Asset turnover fell slightly to 0.71 on June 30, 2022, and a steady decline was observed afterward, with the figures at 0.70 on September 30, 2022.
· With the year ending December 31, 2022, the asset turnover declined rather significantly to 0.67.
· In 2023, the downward trend continued, with March 31 recording an asset turnover of 0.65, while it reduced further to 0.64 by June 30, 2023.
Considering the reported asset turnover at the start (0.59 on December 31, 2020) and the most recent data point (0.64 on June 30, 2023), there was a growth rate of approximately 8.5%.
Nonetheless, more recently, it is evident that there has been a substantial decrease in the asset turnover, beginning in late 2022, signaling an increasing inefficiency in META's use of its assets.
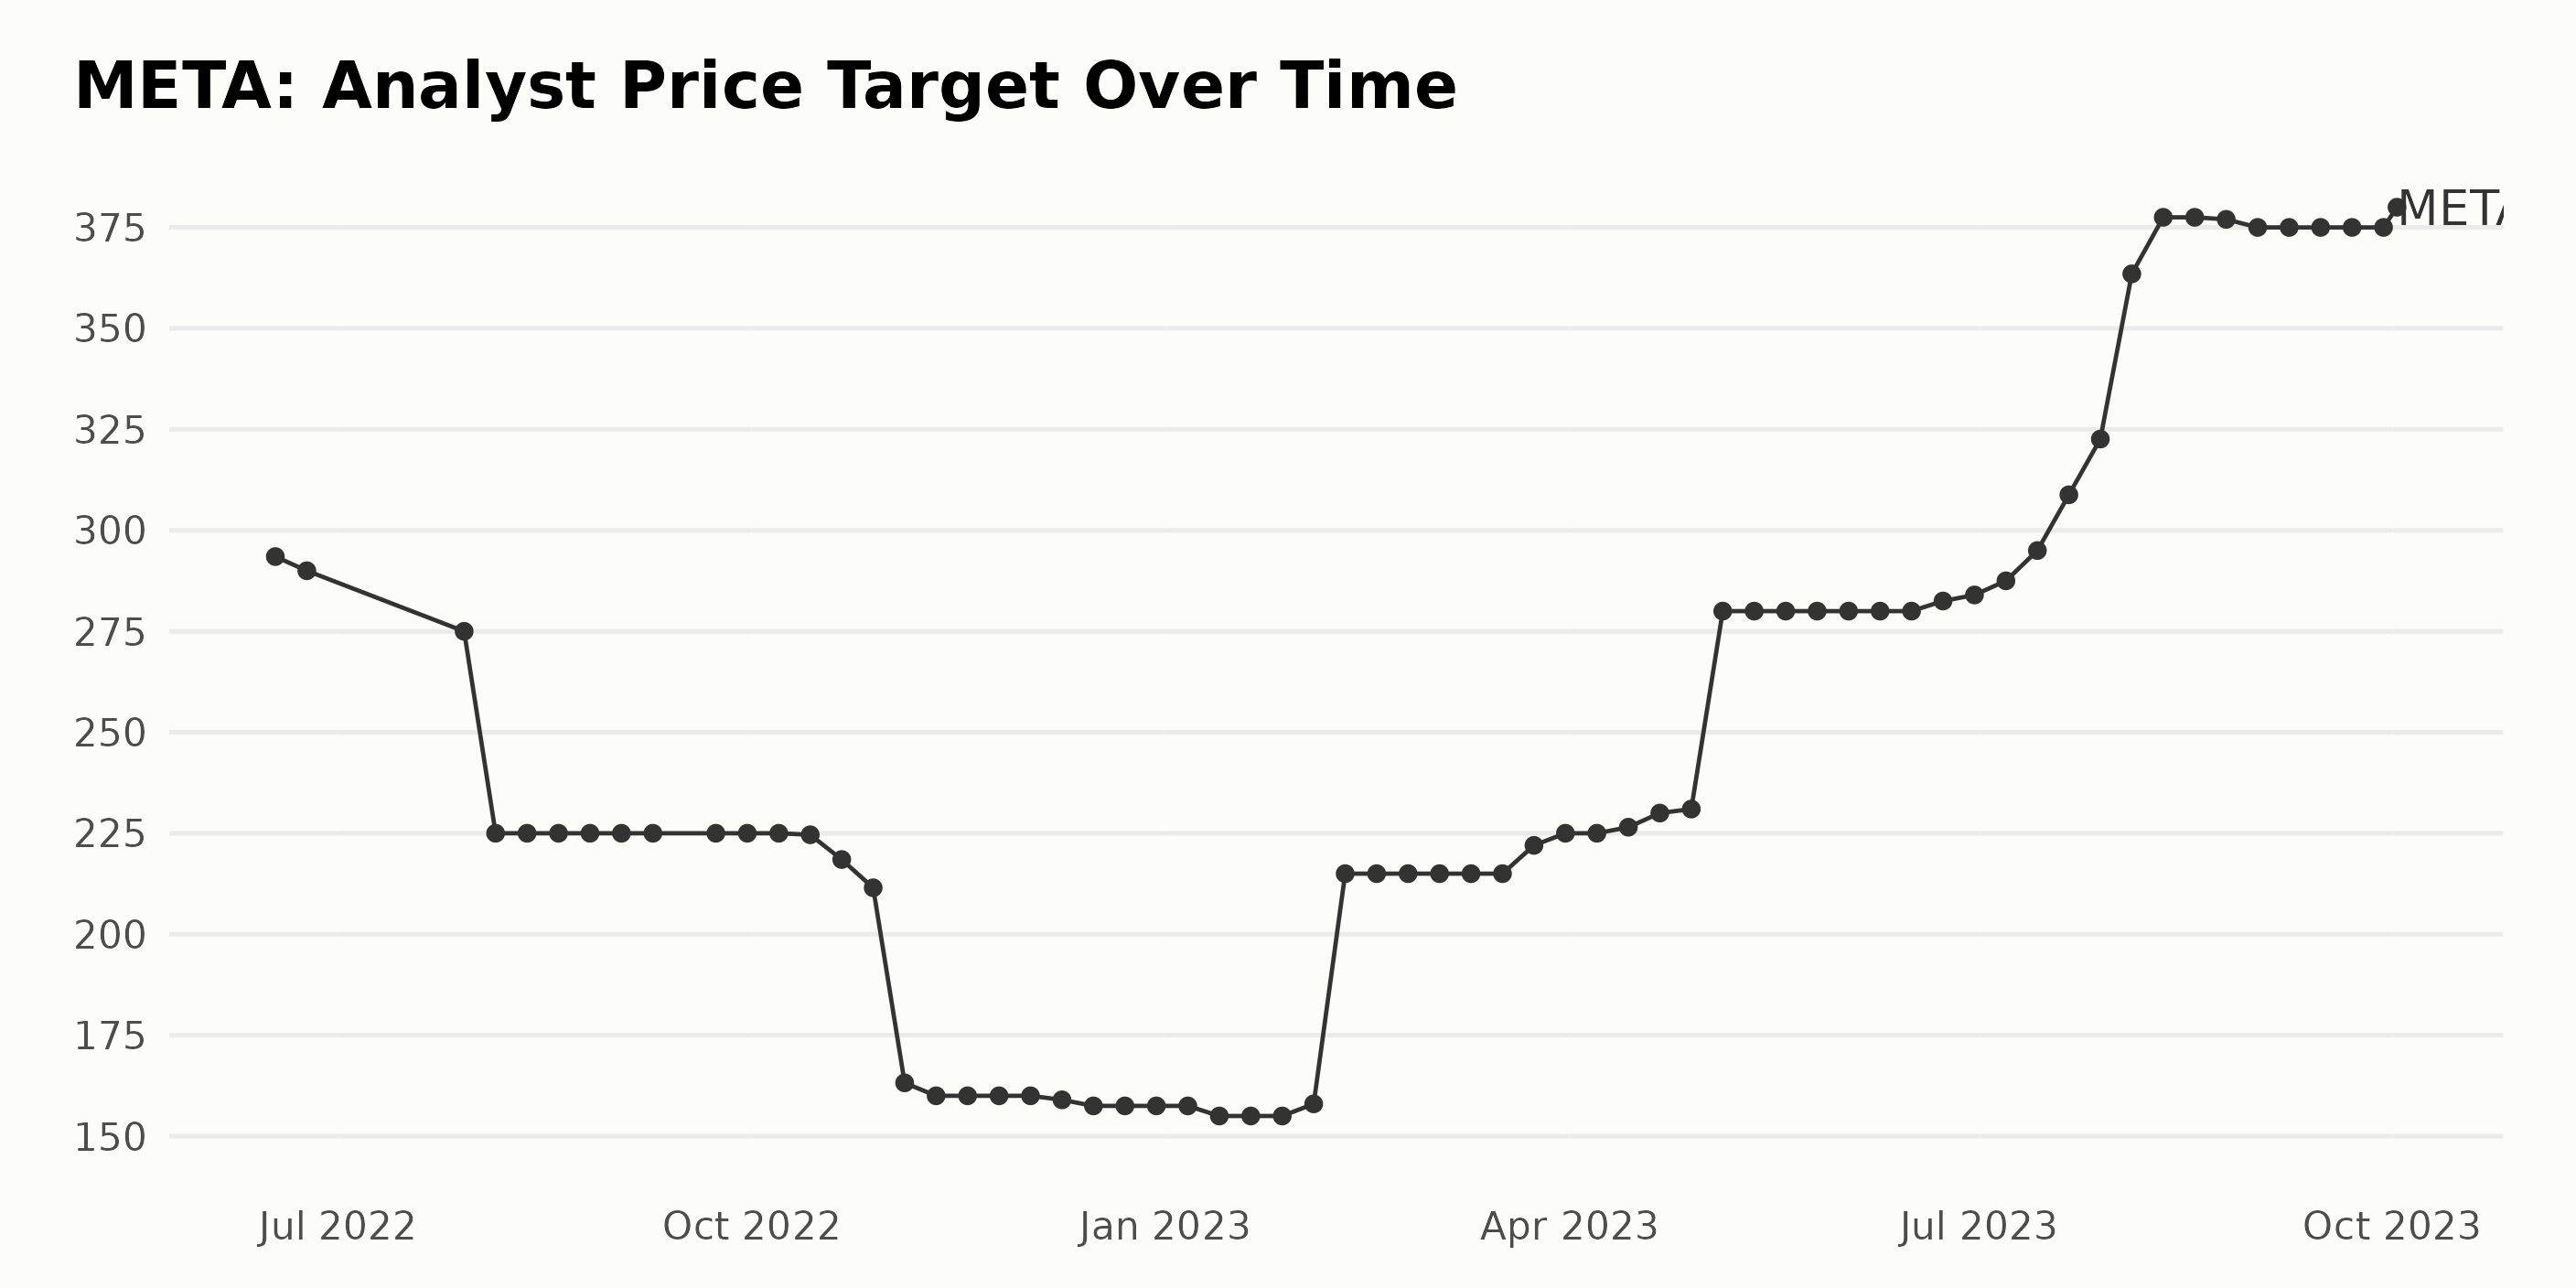
The data records META's reported analyst price target from June 17, 2022, to October 02, 2023.
· The series started with a value of $293.5 on June 17, 2022, and ended at $380 on October 02, 2023.
· This represents a growth rate of roughly 30% over the period of time in question.
· META's price targets have undergone several fluctuations and trends over this time frame. Initially, from June to August 2022, there was a sharp decrease from $293.5 to $225.
· This decreased trend continued till November 2022, reaching a value of $160, which is the lowest point in the series.
· The value remained relatively stable at around $160 for about two months (November-January) before increasing sharply again in February 2023 to reach a value of $215.
· From February to May 2023, the price target remained relatively stable again at a plateau of $215-230 before witnessing another surge to $280 by May 2023.
· The values maintained consistency around $280 until June 2023. After that, a steady incremental trend was observed until it reached the peak value of $377.5 in August 2023.
· The values then slightly declined and stabilized at about $375 for several weeks in September 2023 before finally rising to $380 in early October 2023.
Despite fluctuations, META's analyst price target shows an upward trend with a 30% growth from June 2022 till October 2023.
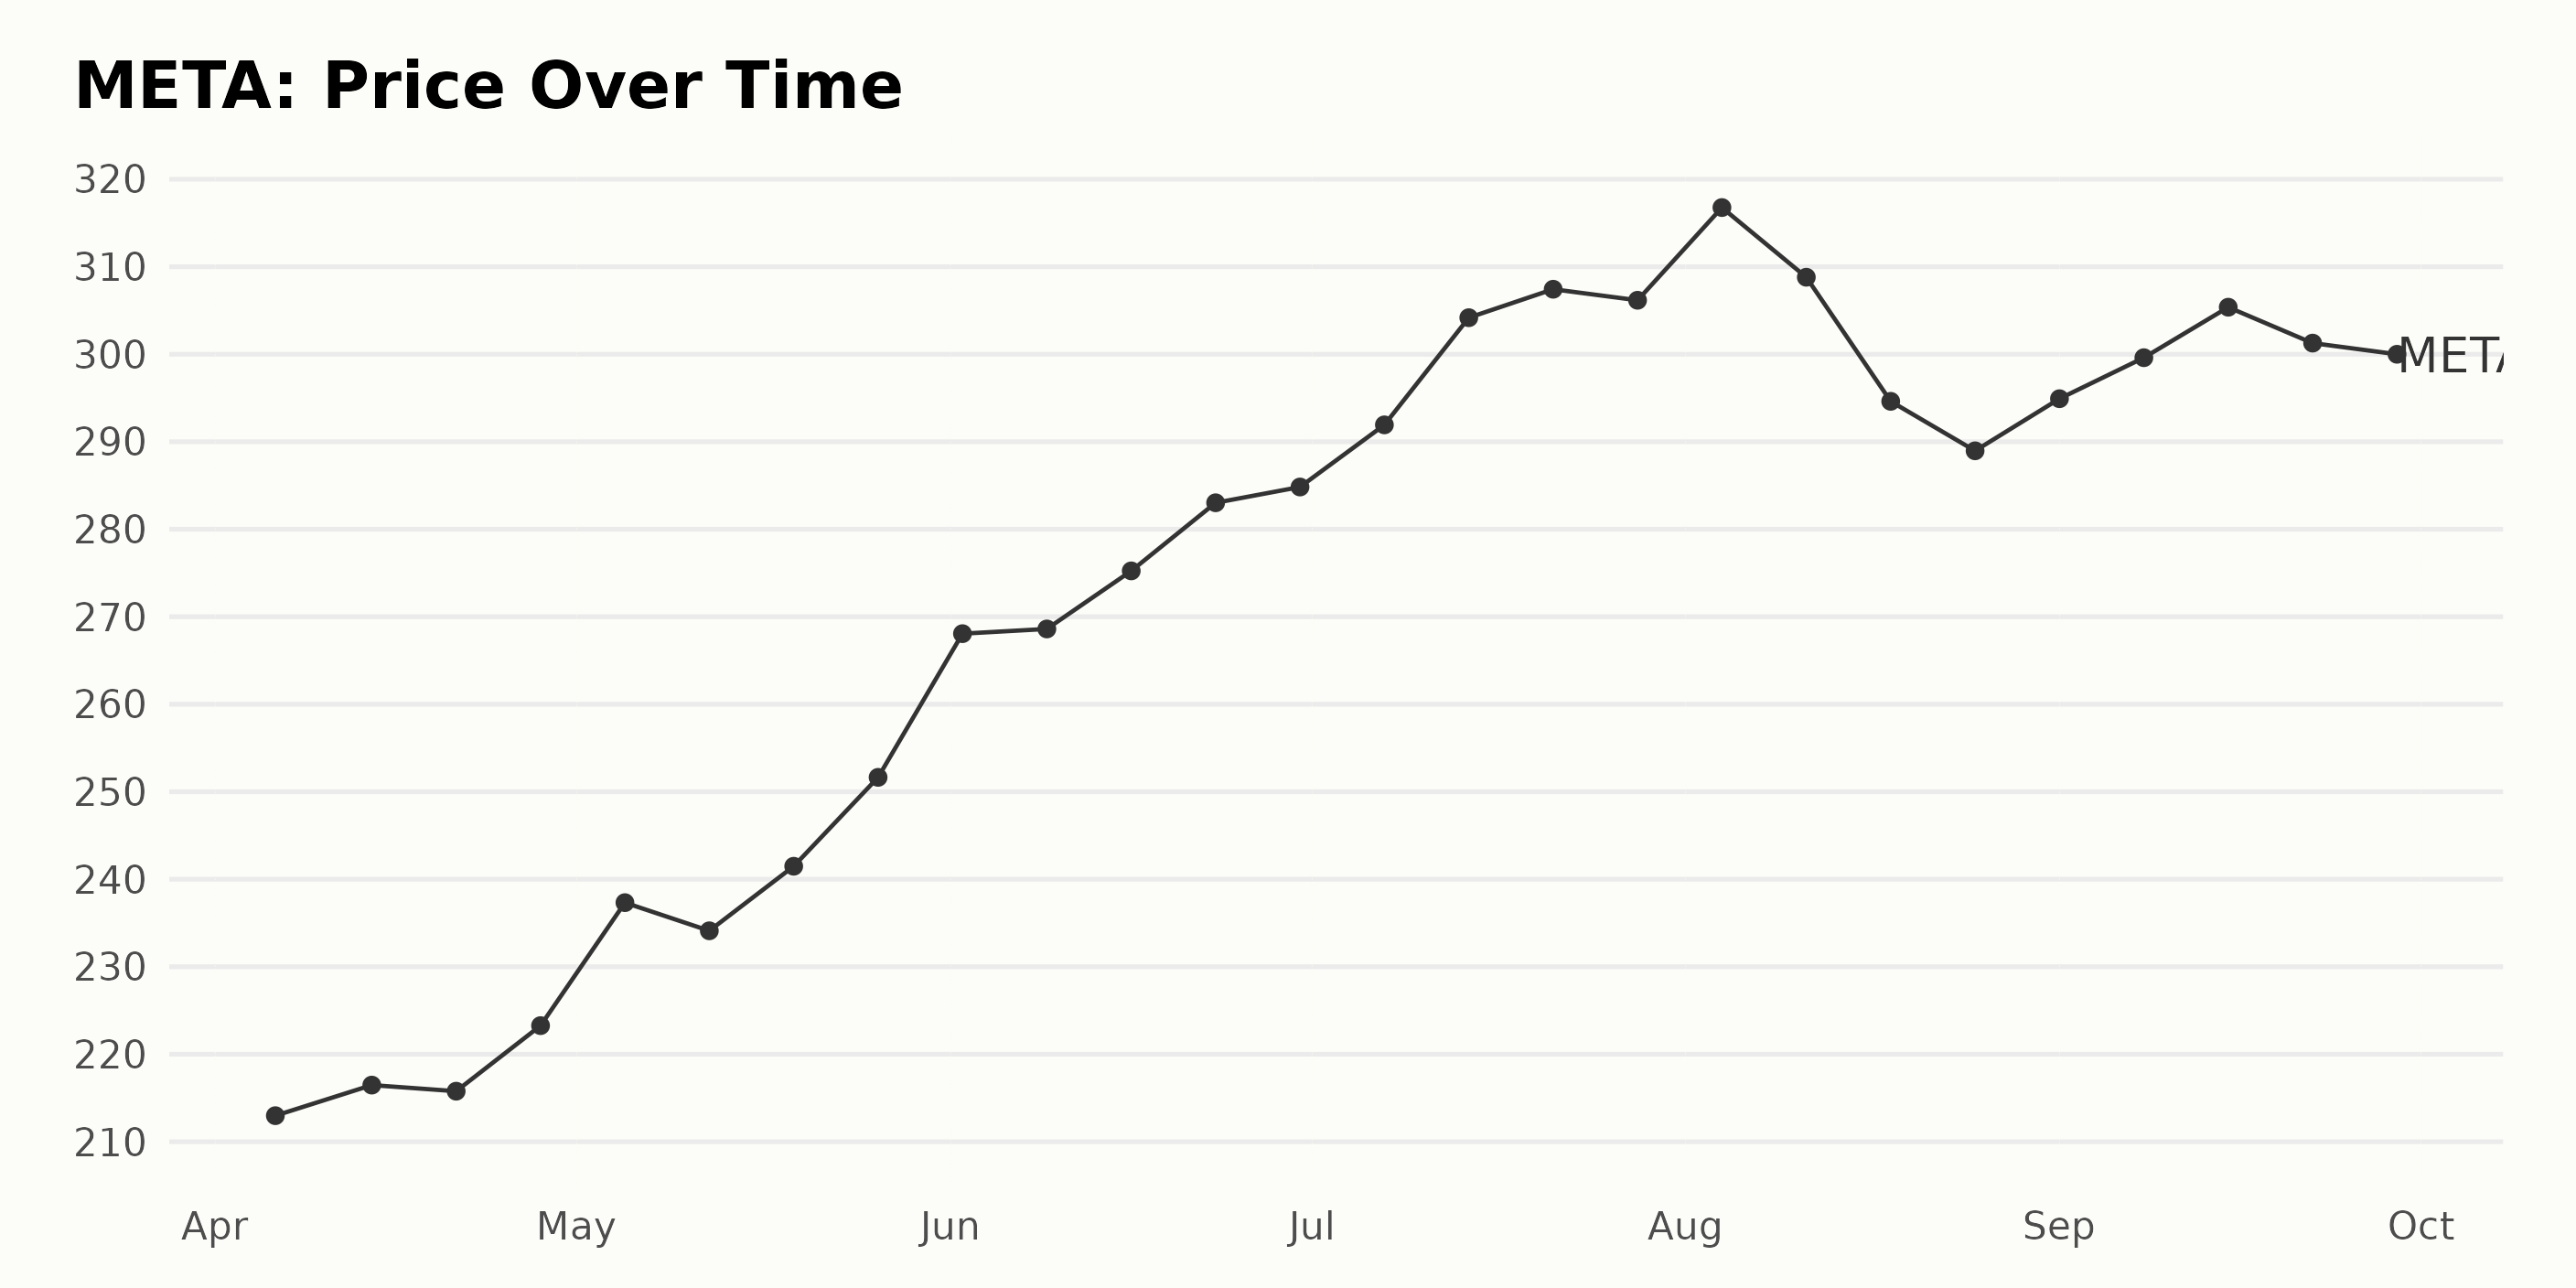
Analyzing META's Share Price Evolution: A Six-Month Study From April to September 2023
The data below shows the trend in META's share price over a period of approximately six months, from April 2023 to September 2023.
· On April 6, 2023, META's share price stood at $212.98 and gradually rose to $216.47 by April 14, 2023.
· Overall, in April 2023, there was a steady increase, with the price reaching a high of $223.27 by the end of the month.
· In May 2023, the share price of META fluctuated initially but ended with a strong upward trend, with a peak price of $251.64.
· The growth continued in June 2023, with the price rising from $268.06 at the start of the month to a high of $284.83 by the end of the month.
· In July 2023, though there were minor fluctuations, the trend was predominantly upward. The price peaked mid-month at $304.17, closing the month at $306.17.
· In August 2023, the share price showed volatility. Initially, it escalated to a high of $316.76 early in the month. However, toward the month's latter half, it experienced a significant drop to $288.96.
· Finally, in September 2023, the price gradually increased early in the month, reaching $305.37 mid-month but closing slightly lower at $299.99 by the end of the month.
Overall, the general trend for META's share price exhibits a growth from $212.98 in April 2023 to $299.99 in September 2023. The growth rate, however, varied during different periods, with acceleration seen mainly in May, June, and July 2023, while deceleration occurred notably towards the latter half of August until the end of September 2023. Here is a chart of META's price over the past 180 days.
Examining META’s High-Performing Dimensions: Quality, Sentiment, and Growth
META's POWR Ratings have shown considerable progress over time. The POWR Ratings assess stocks by 118 different factors, each with its own weighting.
It started with a C grade in April 2023 but later progressed to a B by April 29, 2023, and maintained the upward trend throughout September 2023. It's worth noting that the latest value of META's POWR grade, as per the provided data, is B. This B grade is as of the week ending September 30, 2023.
META's rank in the Internet industry, which houses 59 stocks, also showed improvement during this period. From being #18 in the category in early April 2023, META advanced to #10 by the end of September 2023. Here are some key highlights:
· In April 2023, it started with a POWR grade of C and an industry rank of 18.
· The POWR grade improved to B on April 29, 2023.
· The ranking within the category also improved, reaching #13 by April 29, 2023.
· By September 30, 2023, META maintained its overall rating of B and achieved a rank of 10 in the Internet industry.
Remember, lower values are better in these rankings and denote a higher ranking within the category. Based on this data, META's performance has a positive trajectory according to the POWR grade and its relative ranking within the Internet stocks category.
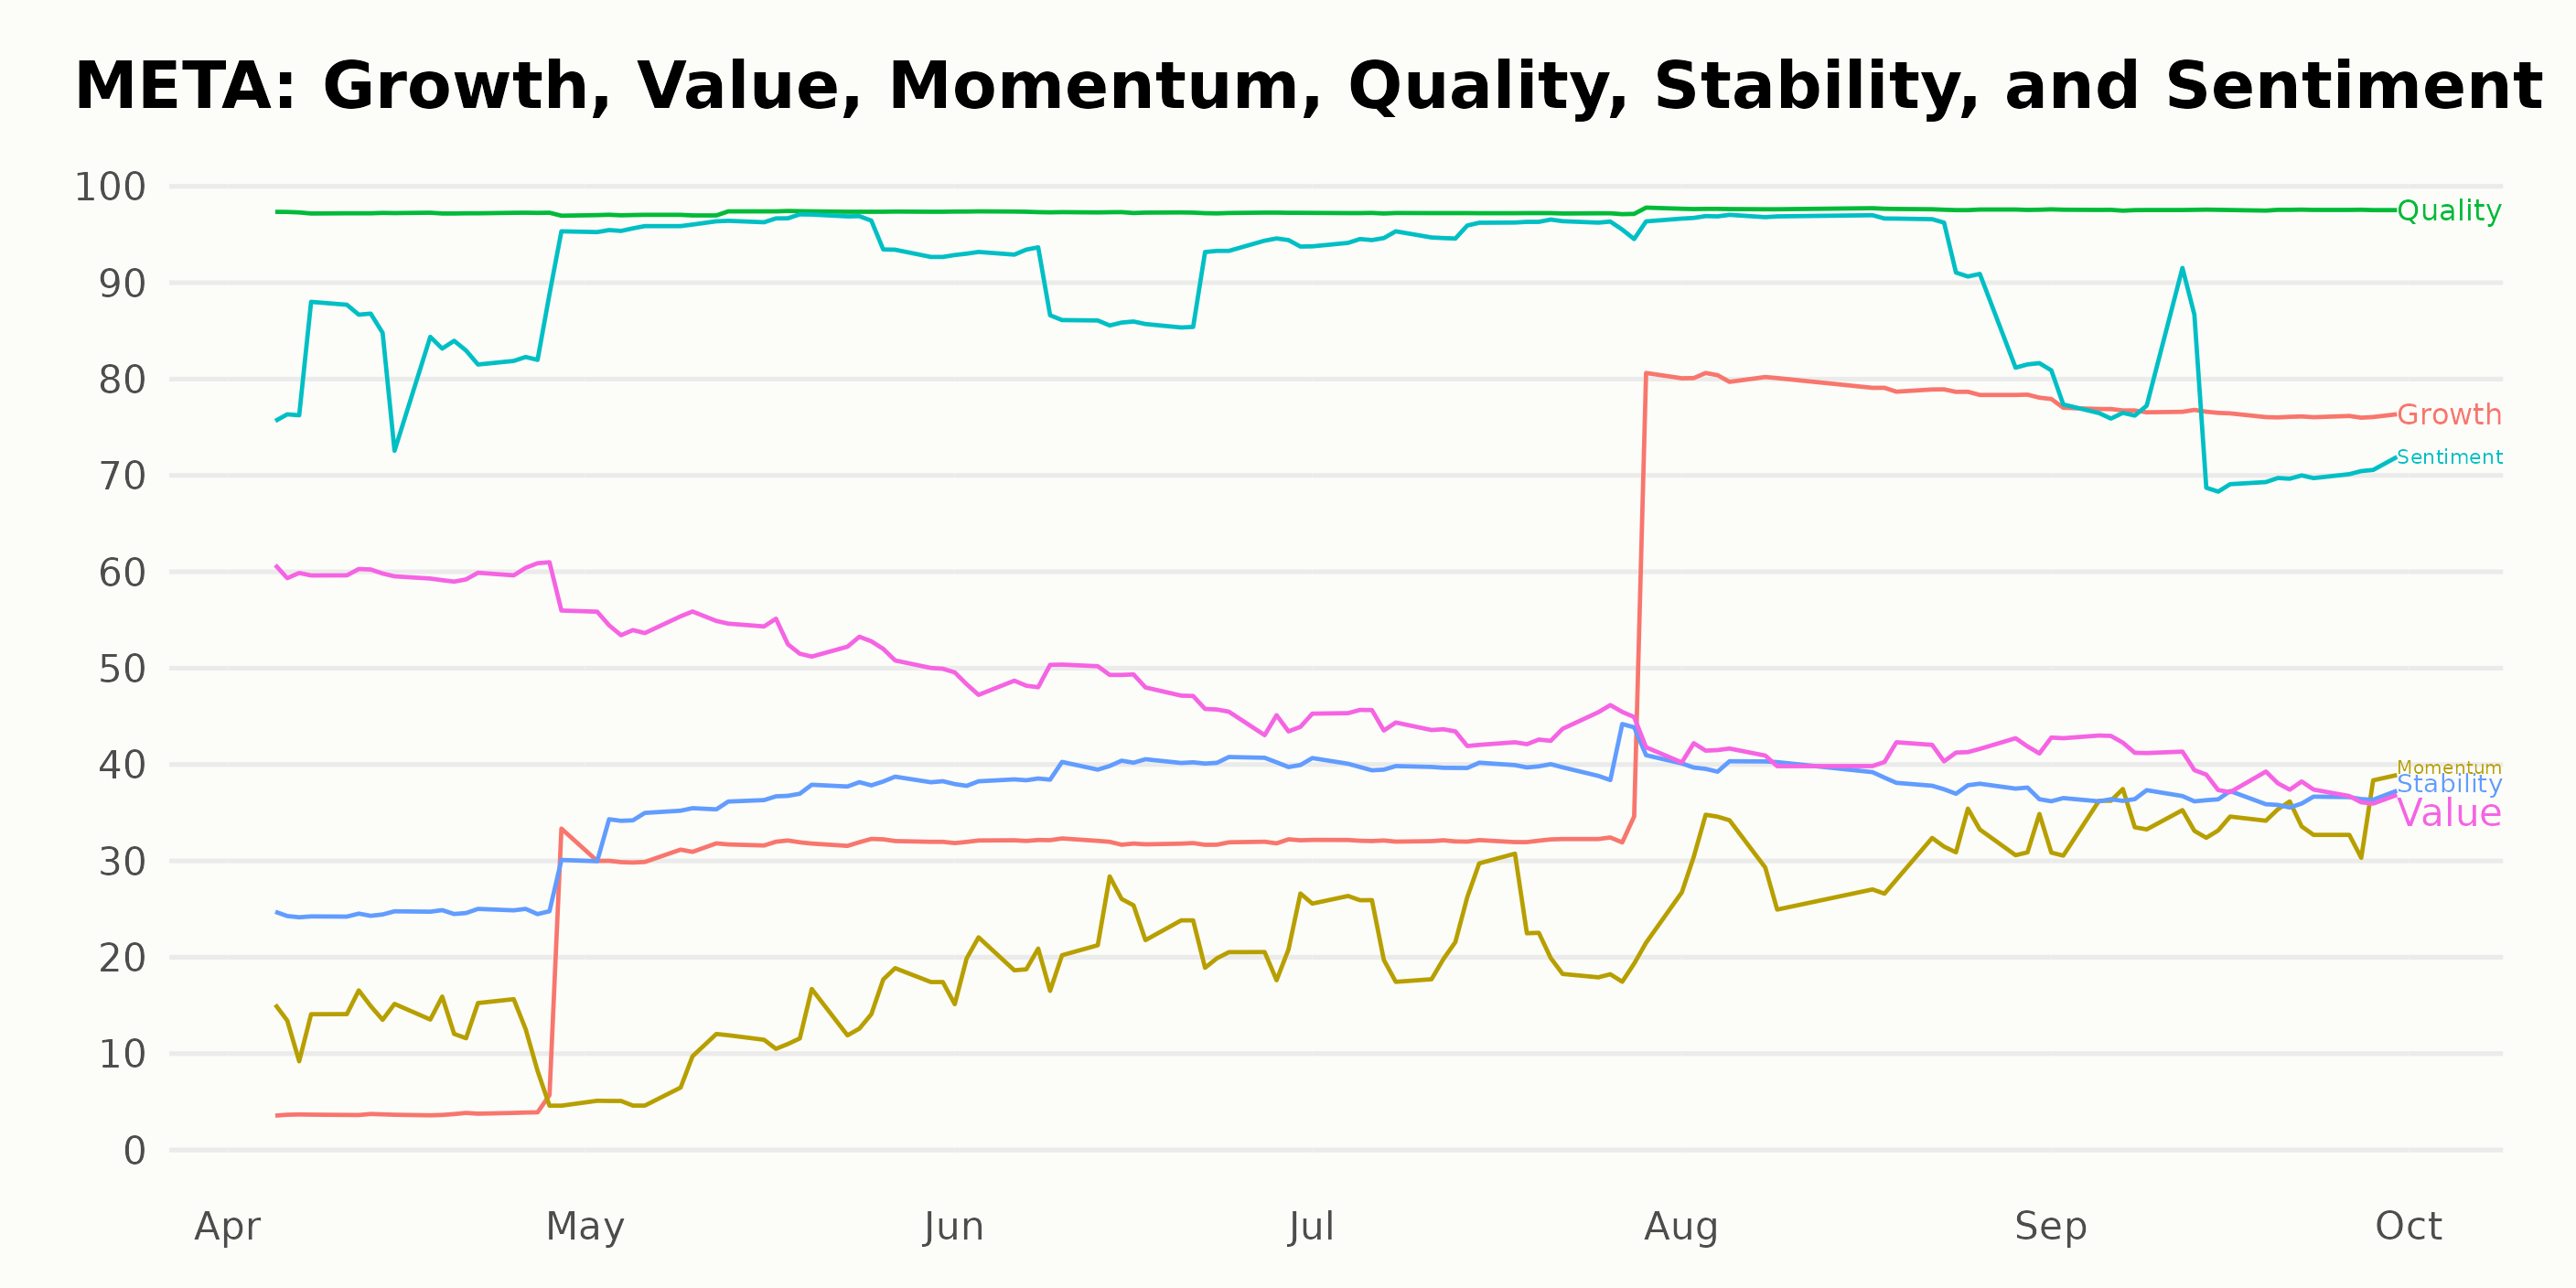
In reviewing the POWR Ratings for META, there are three dimensions that are particularly noteworthy due to their high ratings over time: Quality, Sentiment, and Growth.
· Quality: This dimension consistently sees the highest performance for META. The Quality rating remains steady at 97 in April, May, June, and July 2023. It then experienced a minor increase to 98 in August and September of 2023, marking it as consistently the highest-scoring category across all monitored periods.
· Sentiment: The Sentiment dimension shows strong ratings ranging from a low of 83 in April 2023 to a high of 96 in May 2023. Although experiencing some fluctuation across the period, with a slight drop to 90 in June 2023 and then a rebound to 95 in July, it remains one of the highest-rated dimensions for META.
· Growth: The Growth rating demonstrates a significant upward trend over time. Starting at only 5 in April 2023, it escalated to an impressive 79 and 77 in August and September 2023, respectively. The remarkable progression across months signals META's expanding growth potential.
These three dimensions — Quality, Sentiment, and Growth — are the most noteworthy among the six assessed in the POWR Ratings for META. They represent areas where META performs exceptionally well, as indicated by the consistently high ratings or clear positive trends.
How Does Meta Platforms Inc. (META) Stack Up Against Its Peers?
While META has an overall grade of B (Buy), other stocks in the Internet industry worth considering are Yelp Inc. (YELP), Travelzoo (TZOO), and Despegar.com Corp. (DESP), with an overall rating of A (Strong Buy) or B.
What To Do Next?
Discover 10 widely held stocks that our proprietary model shows have tremendous downside potential. Please make sure none of these “death trap” stocks are lurking in your portfolio:
META shares were trading at $306.82 per share on Monday afternoon, up $6.61 (+2.20%). Year-to-date, META has gained 154.96%, versus a 12.98% rise in the benchmark S&P 500 index during the same period.
About the Author: Rashmi Kumari

Rashmi is passionate about capital markets, wealth management, and financial regulatory issues, which led her to pursue a career as an investment analyst. With a master's degree in commerce, she aspires to make complex financial matters understandable for individual investors and help them make appropriate investment decisions.
The post Are There Profit Opportunities in October for Meta Platforms (META)? appeared first on StockNews.com