
While software companies continue to prioritize the development of artificial intelligence (AI) capabilities, AI hardware is also gaining significant traction. Advanced Micro Devices, Inc. (AMD), a leading chip manufacturer, recently unveiled its Instinct MI300 series chips for generative AI, directly challenging market leader NVIDIA Corporation (NVDA).
The new chip is expected to be released in the third quarter, with mass production starting in the fourth quarter. However, AMD has not yet provided information about which companies will adopt the MI300X or its smaller counterpart, the MI300A.
The company’s shares slumped following AMD’s AI strategy presentation. “I think the lack of a (large customer) saying they will use the MI300 A or X may have disappointed the Street. They want AMD to say they have replaced Nvidia in some design,” said Kevin Krewell, principal analyst at TIRIAS Research.
Furthermore, the stock was negatively affected by news of the elimination of Section 230 immunity for generative AI.
Due to prevailing macroeconomic factors, the semiconductor industry is anticipated to remain under pressure this year. Gartner forecasts an 11.2% decrease in global semiconductor revenue in 2023.
“As economic headwinds persist, weak end-market electronics demand is spreading from consumers to businesses, creating an uncertain investment environment. In addition, an oversupply of chips which is elevating inventories and reducing chip prices, is accelerating the decline of the semiconductor market this year,” said Richard Gordon, Practice Vice President at Gartner.
In its last reported quarter, AMD experienced a 9% year-over-year decrease in revenue, primarily attributed to faltering performance in the PC industry. Consequently, the company’s bottom line has plunged into negative territory. Its net loss came in at $139 million, or 9 cents per share, from a net income of $786 million, or 56 cents per share, in the prior-year quarter.
This article further explores the metrics indicative of AMD’s struggles, reinforcing our bearish outlook.
Analyzing AMD’s Financial Performance: Net Income, Revenue, and Gross Margin Trends
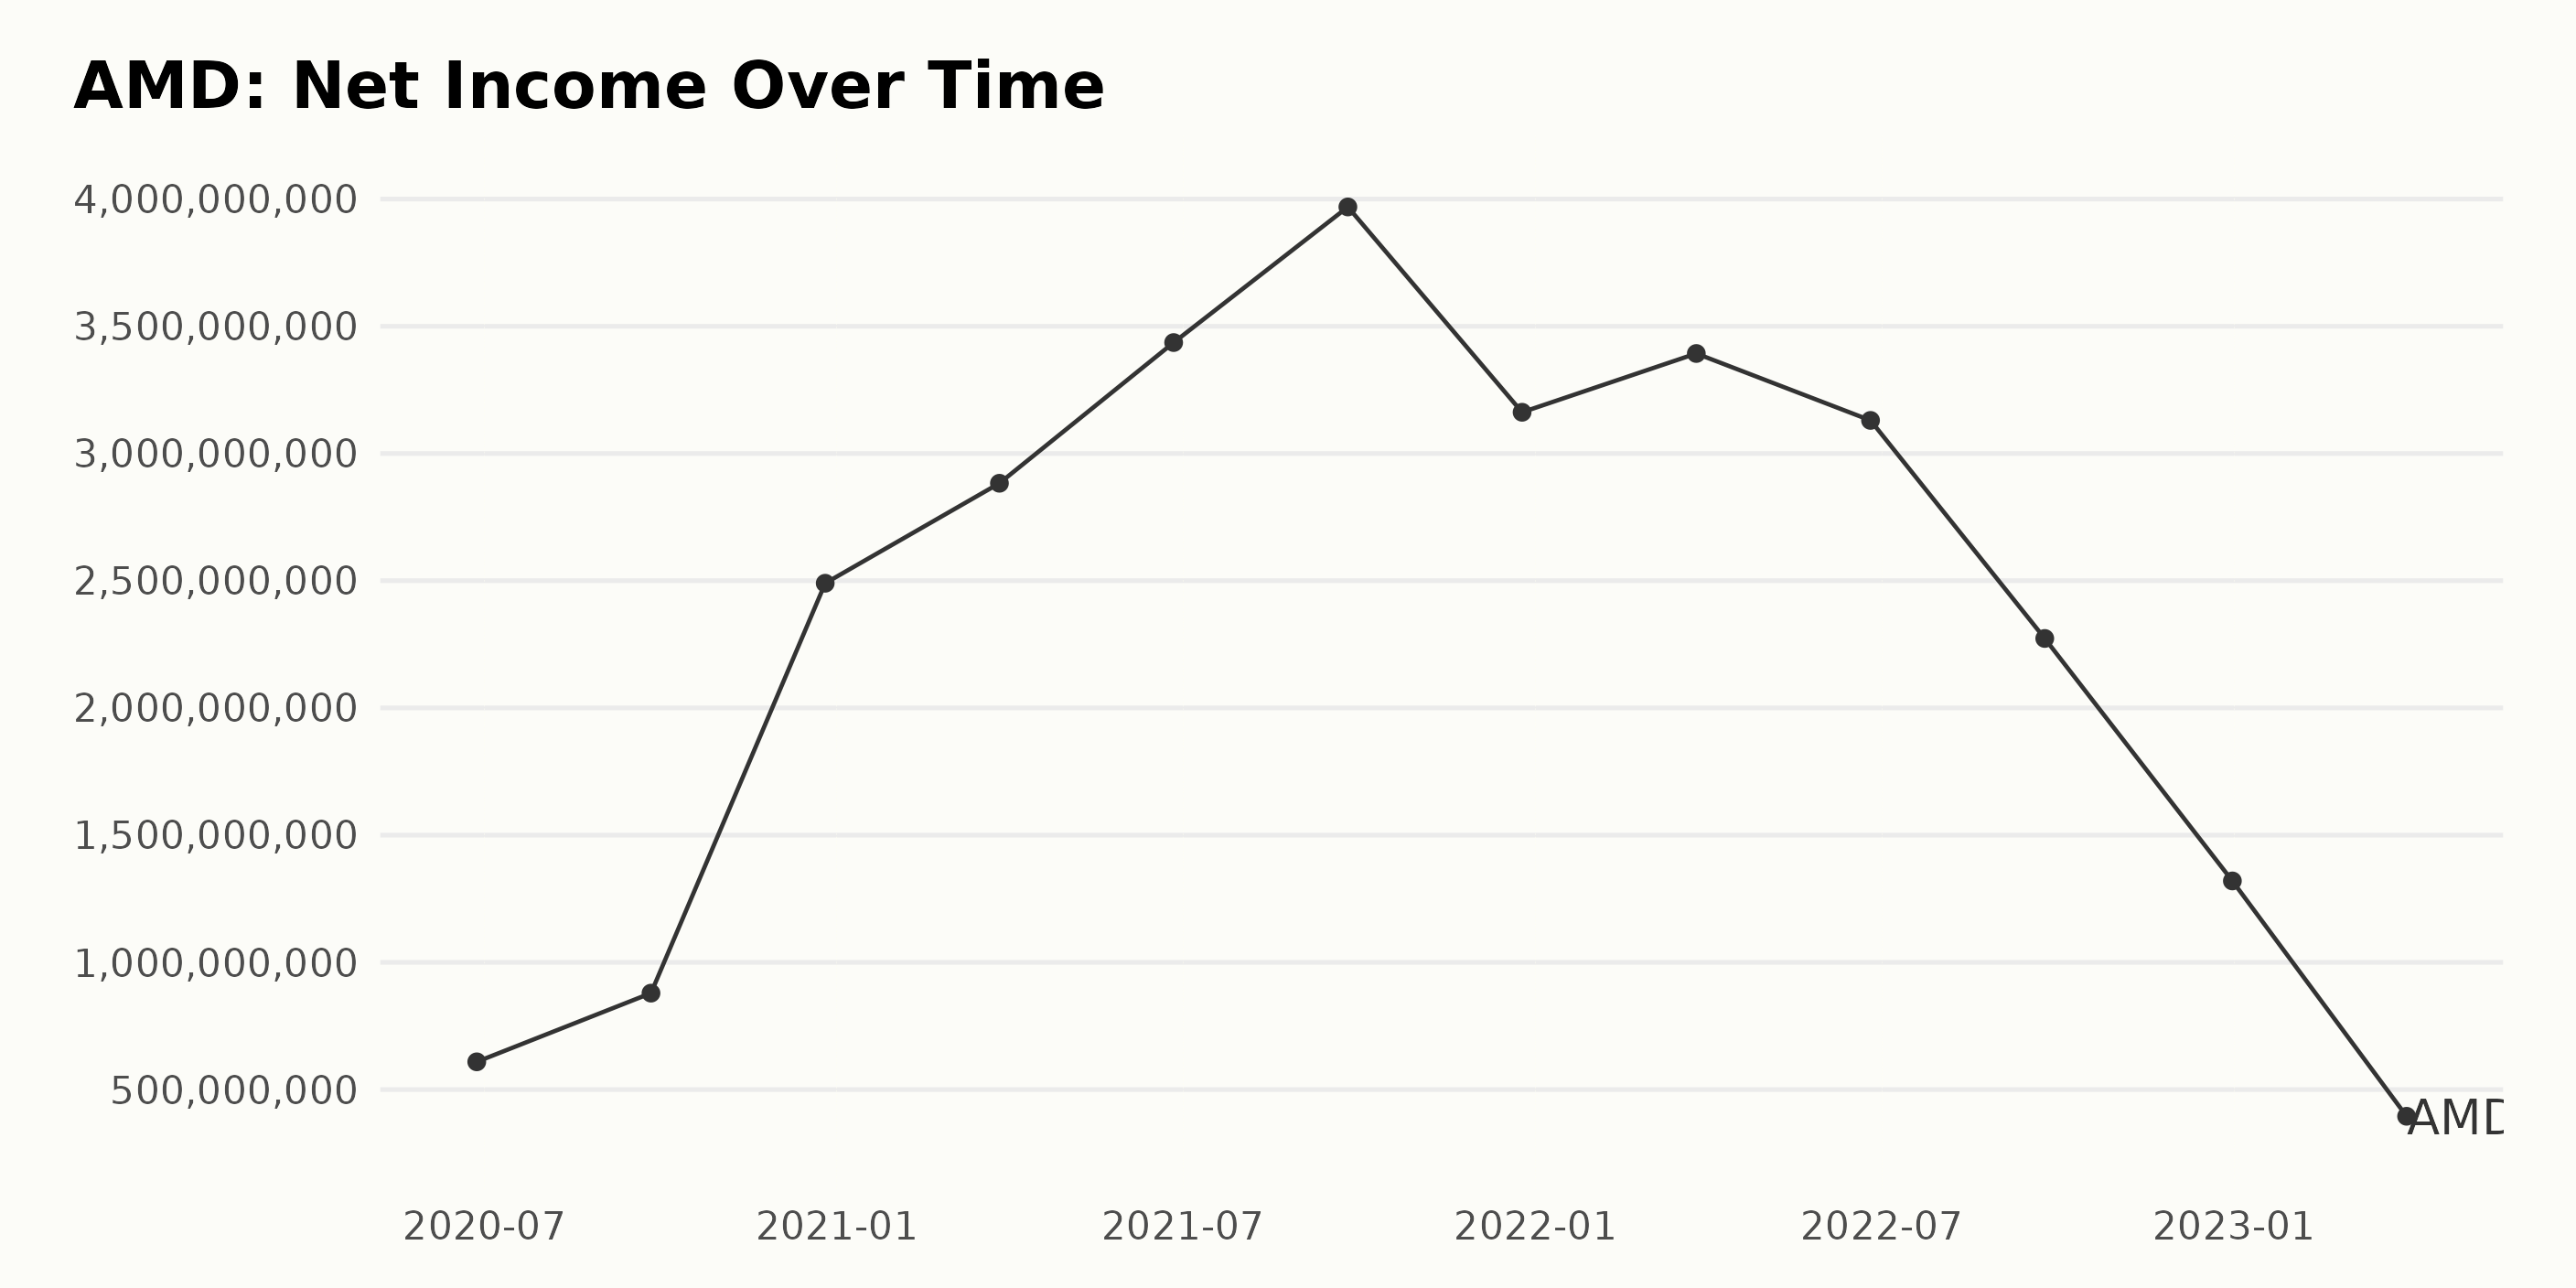
The data series for AMD’s trailing-12-month net income showcases a general upward trend with fluctuations over time. Here are the key highlights:
- June 2020: $609 million
- September 2020: $879 million
- December 2020: $2.49 billion
- March 2021: $2.88 billion
- June 2021: $3.44 billion
- September 2021: $3.97 billion
- December 2021: $3.16 billion
- March 2022: $3.39 billion
- June 2022: $3.13 billion
- September 2022: $2.27 billion
- December 2022: $1.32 billion
- April 2023: $395 million
From June 2020 to April 2023, AMD’s net income grew significantly from $609 million to $395 million, with the highest net income of $3.97 billion recorded in September 2021. However, there have been some fluctuations and reductions in recent periods. In December 2022, the net income dropped to $1.32 billion, followed by a further decline to $395 million in April 2023. Despite these recent fluctuations, the overall trend for AMD’s net income remains positive, indicating growth in the long term.
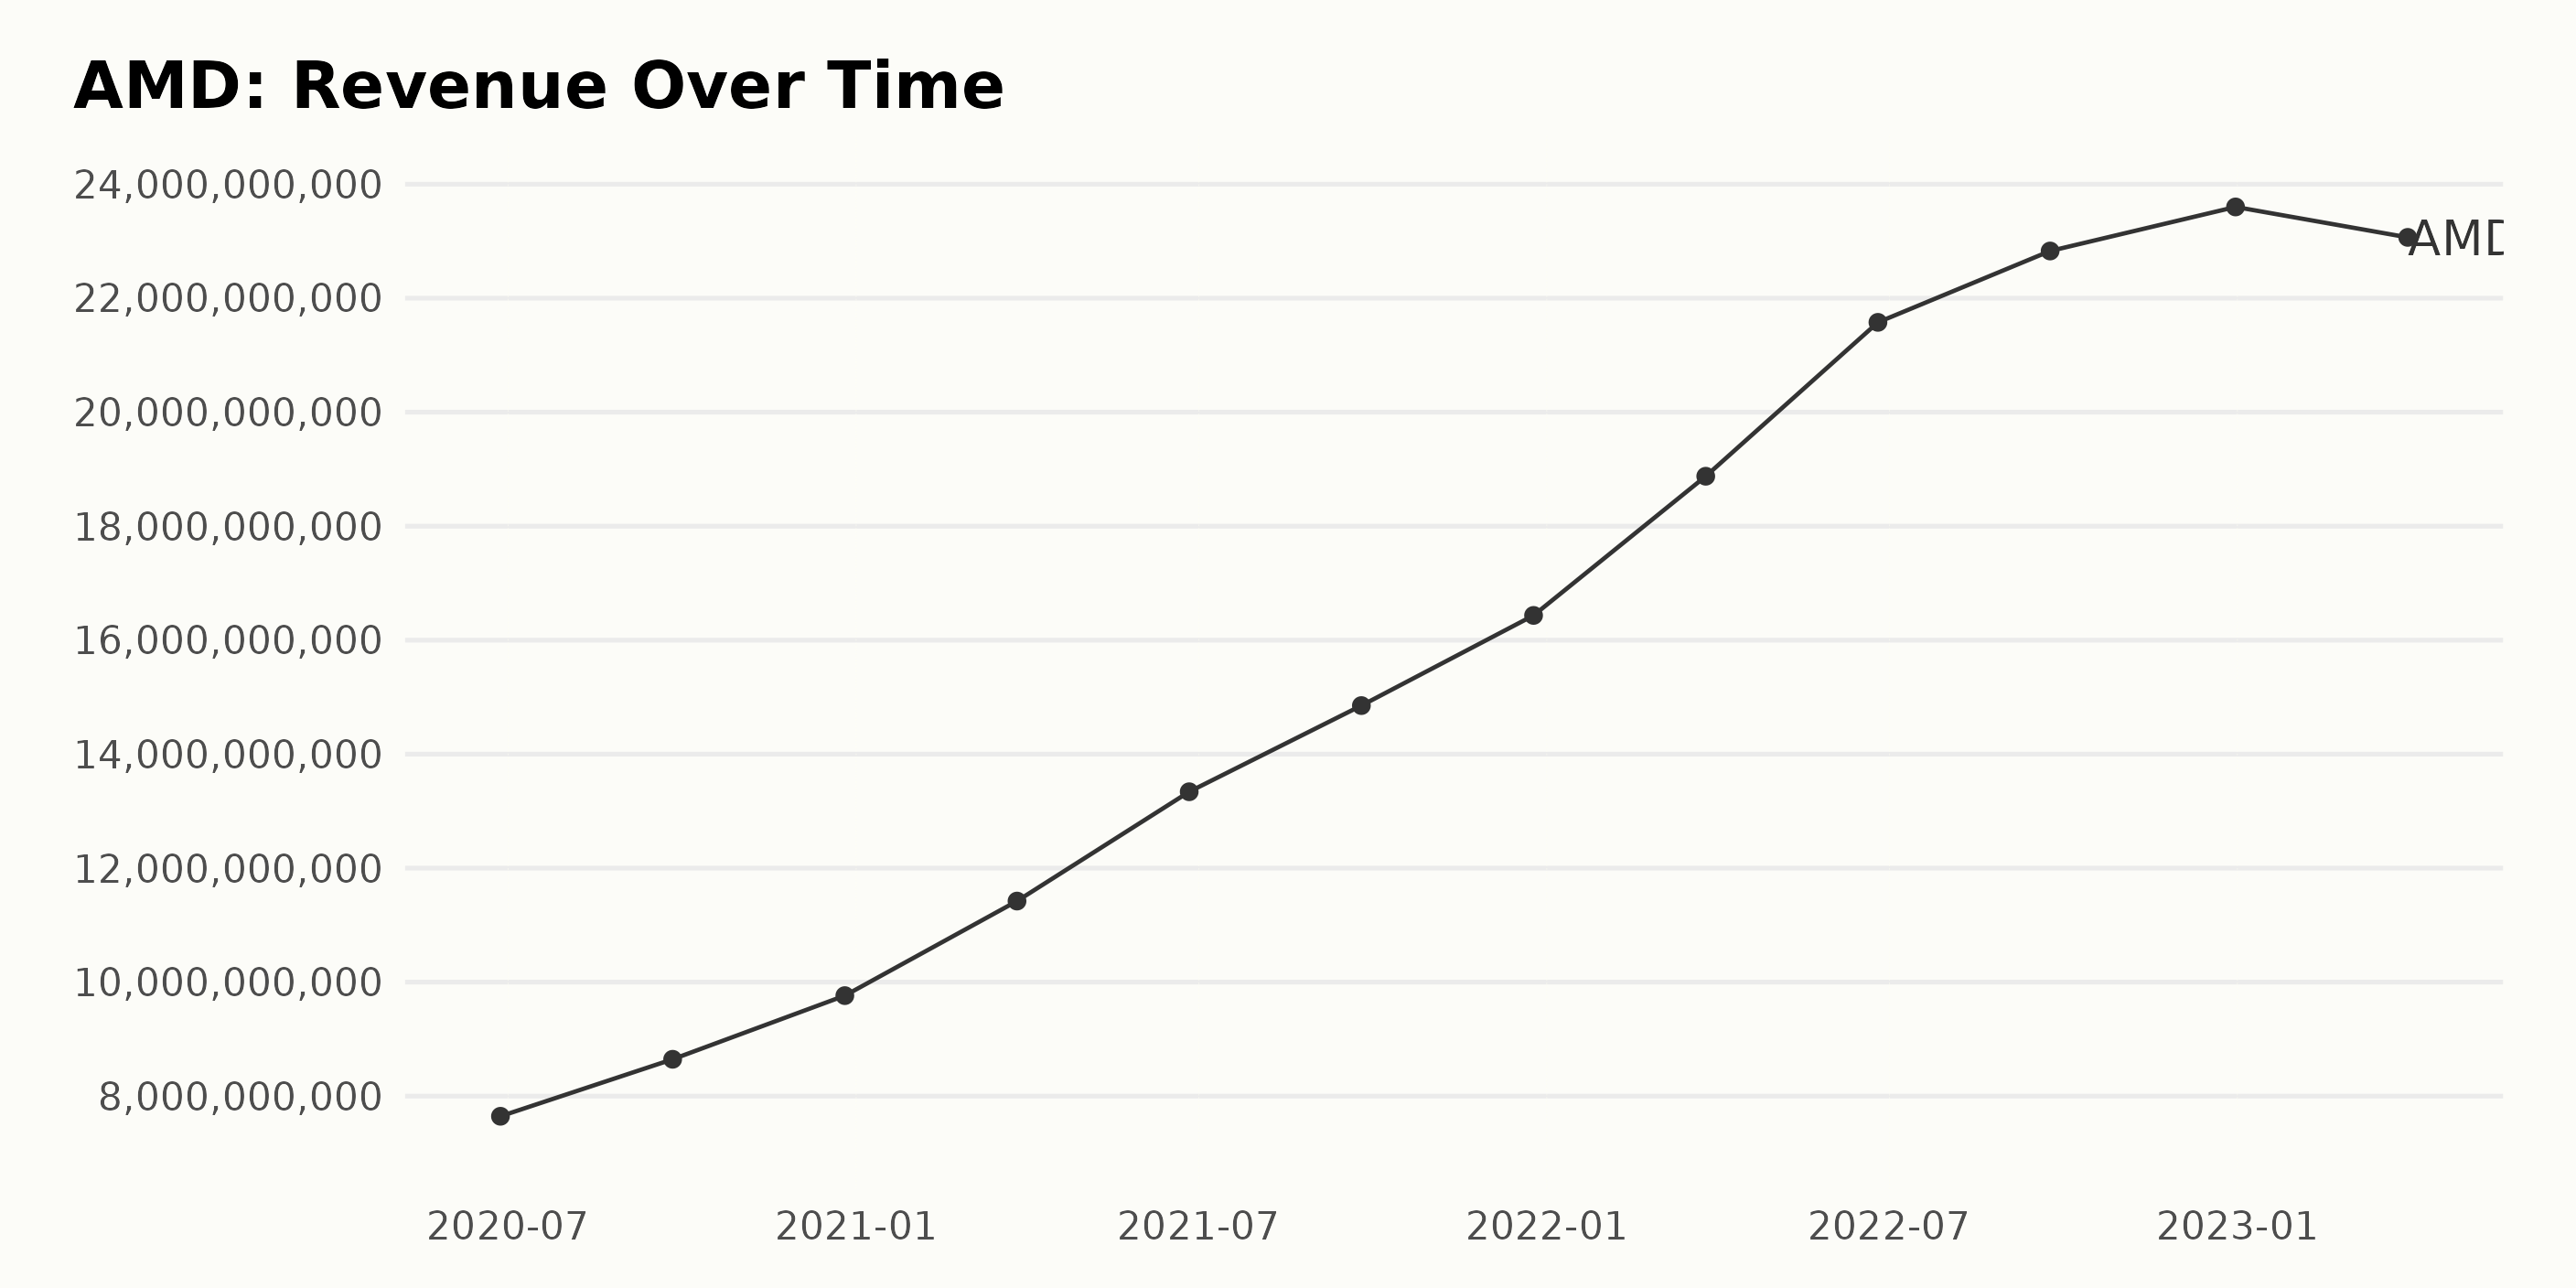
AMD has experienced a generally increasing trend in trailing-12-month revenue over the given period, as illustrated by the following key points:
- June 2020: $7.65 billion
- September 2020: $8.65 billion
- December 2020: $9.76 billion
- March 2021: $11.42 billion
- June 2021: $13.34 billion
- September 2021: $14.85 billion
- December 2021: $16.43 billion
- March 2022: $18.88 billion
- June 2022: $21.58 billion
- September 2022: $22.83 billion
- December 2022: $23.60 billion
- April 2023: $23.07 billion
There have been fluctuations throughout this period, particularly with minor slowdowns in growth from September to December in both 2021 and 2022. However, it is important to note that the more recent data shows a slight decrease in revenue from December 2022 ($23.60 billion) to April 2023 ($23.07 billion). Overall, AMD’s revenue has grown significantly, with a growth rate of approximately 201.75%, calculated based on the increase from the first value ($7.65 billion in June 2020) to the last ($23.07 billion in April 2023).
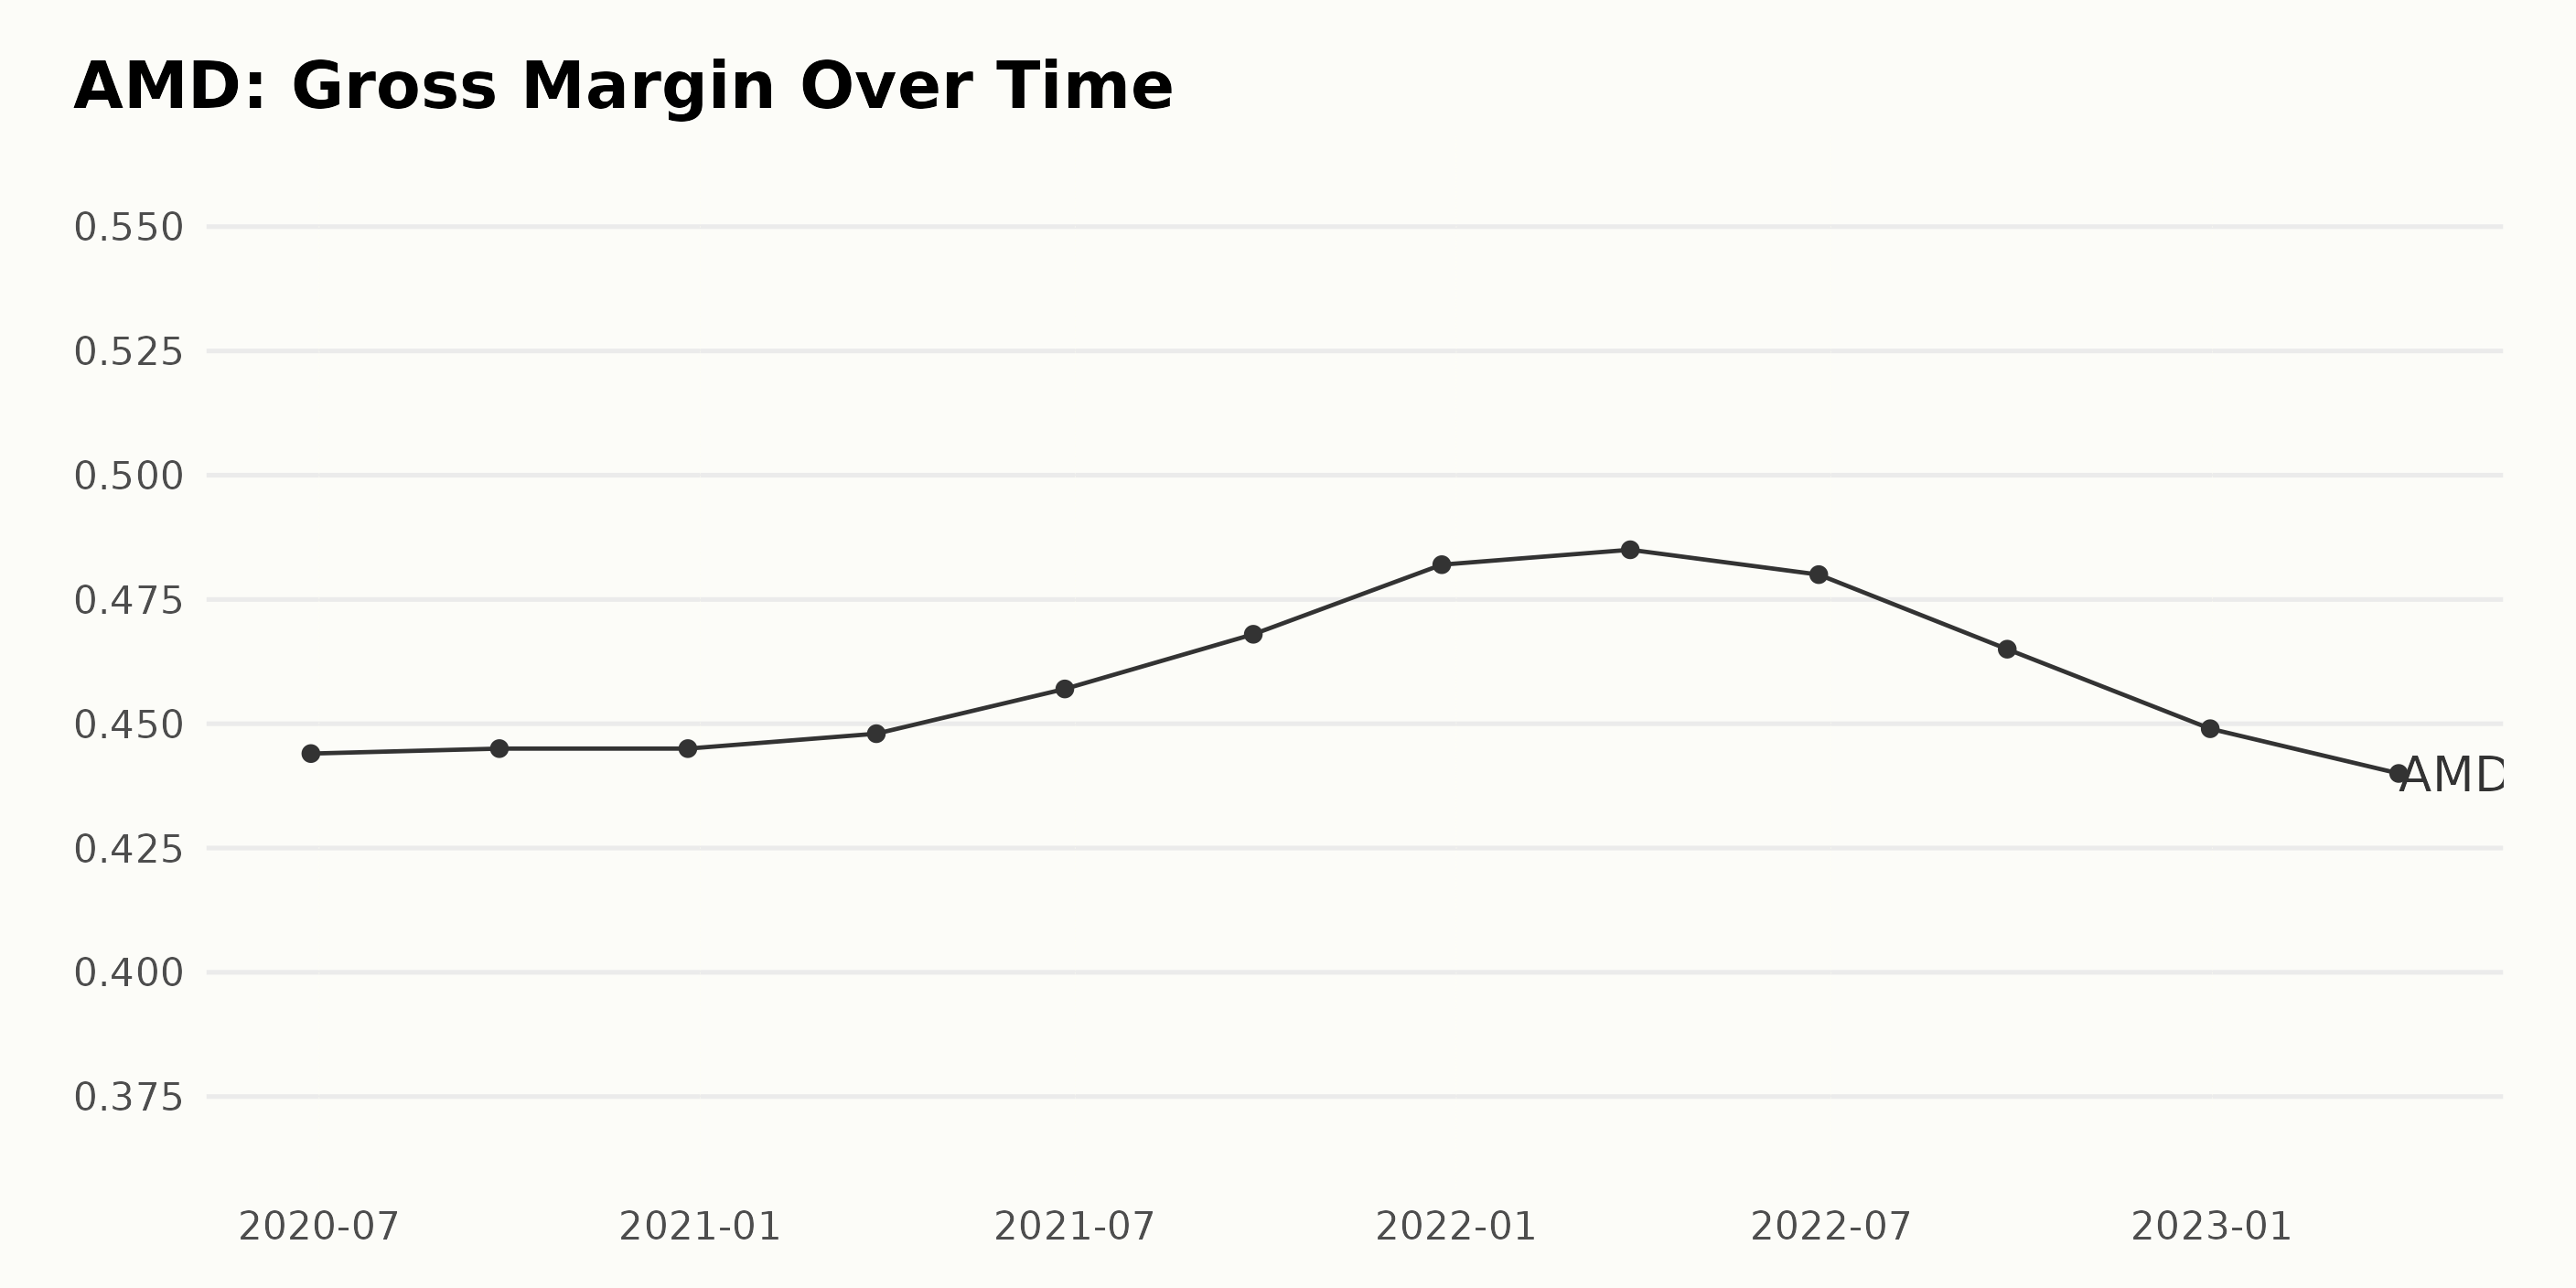
The gross margin of AMD has experienced fluctuations and a downward trend in the recent period. Here is a summary of key data points:
- June 2020: 44.4%
- September 2020: 44.5%
- December 2020: 44.5%
- March 2021: 44.8%
- June 2021: 45.7%
- September 2021: 46.8%
- December 2021: 48.2%
- March 2022: 48.5%
- June 2022: 48.0%
- September 2022: 46.5%
- December 2022: 44.9%
- April 2023: 44.0%
The most recent value (April 2023) shows a gross margin of 44.0%, which is a decrease from the peak value of 48.5% in March 2022. Overall, the growth rate between the first value (June 2020) and the last value (April 2023) is -0.4%. Although there was an upward trend in the gross margin until March 2022, it declined thereafter.
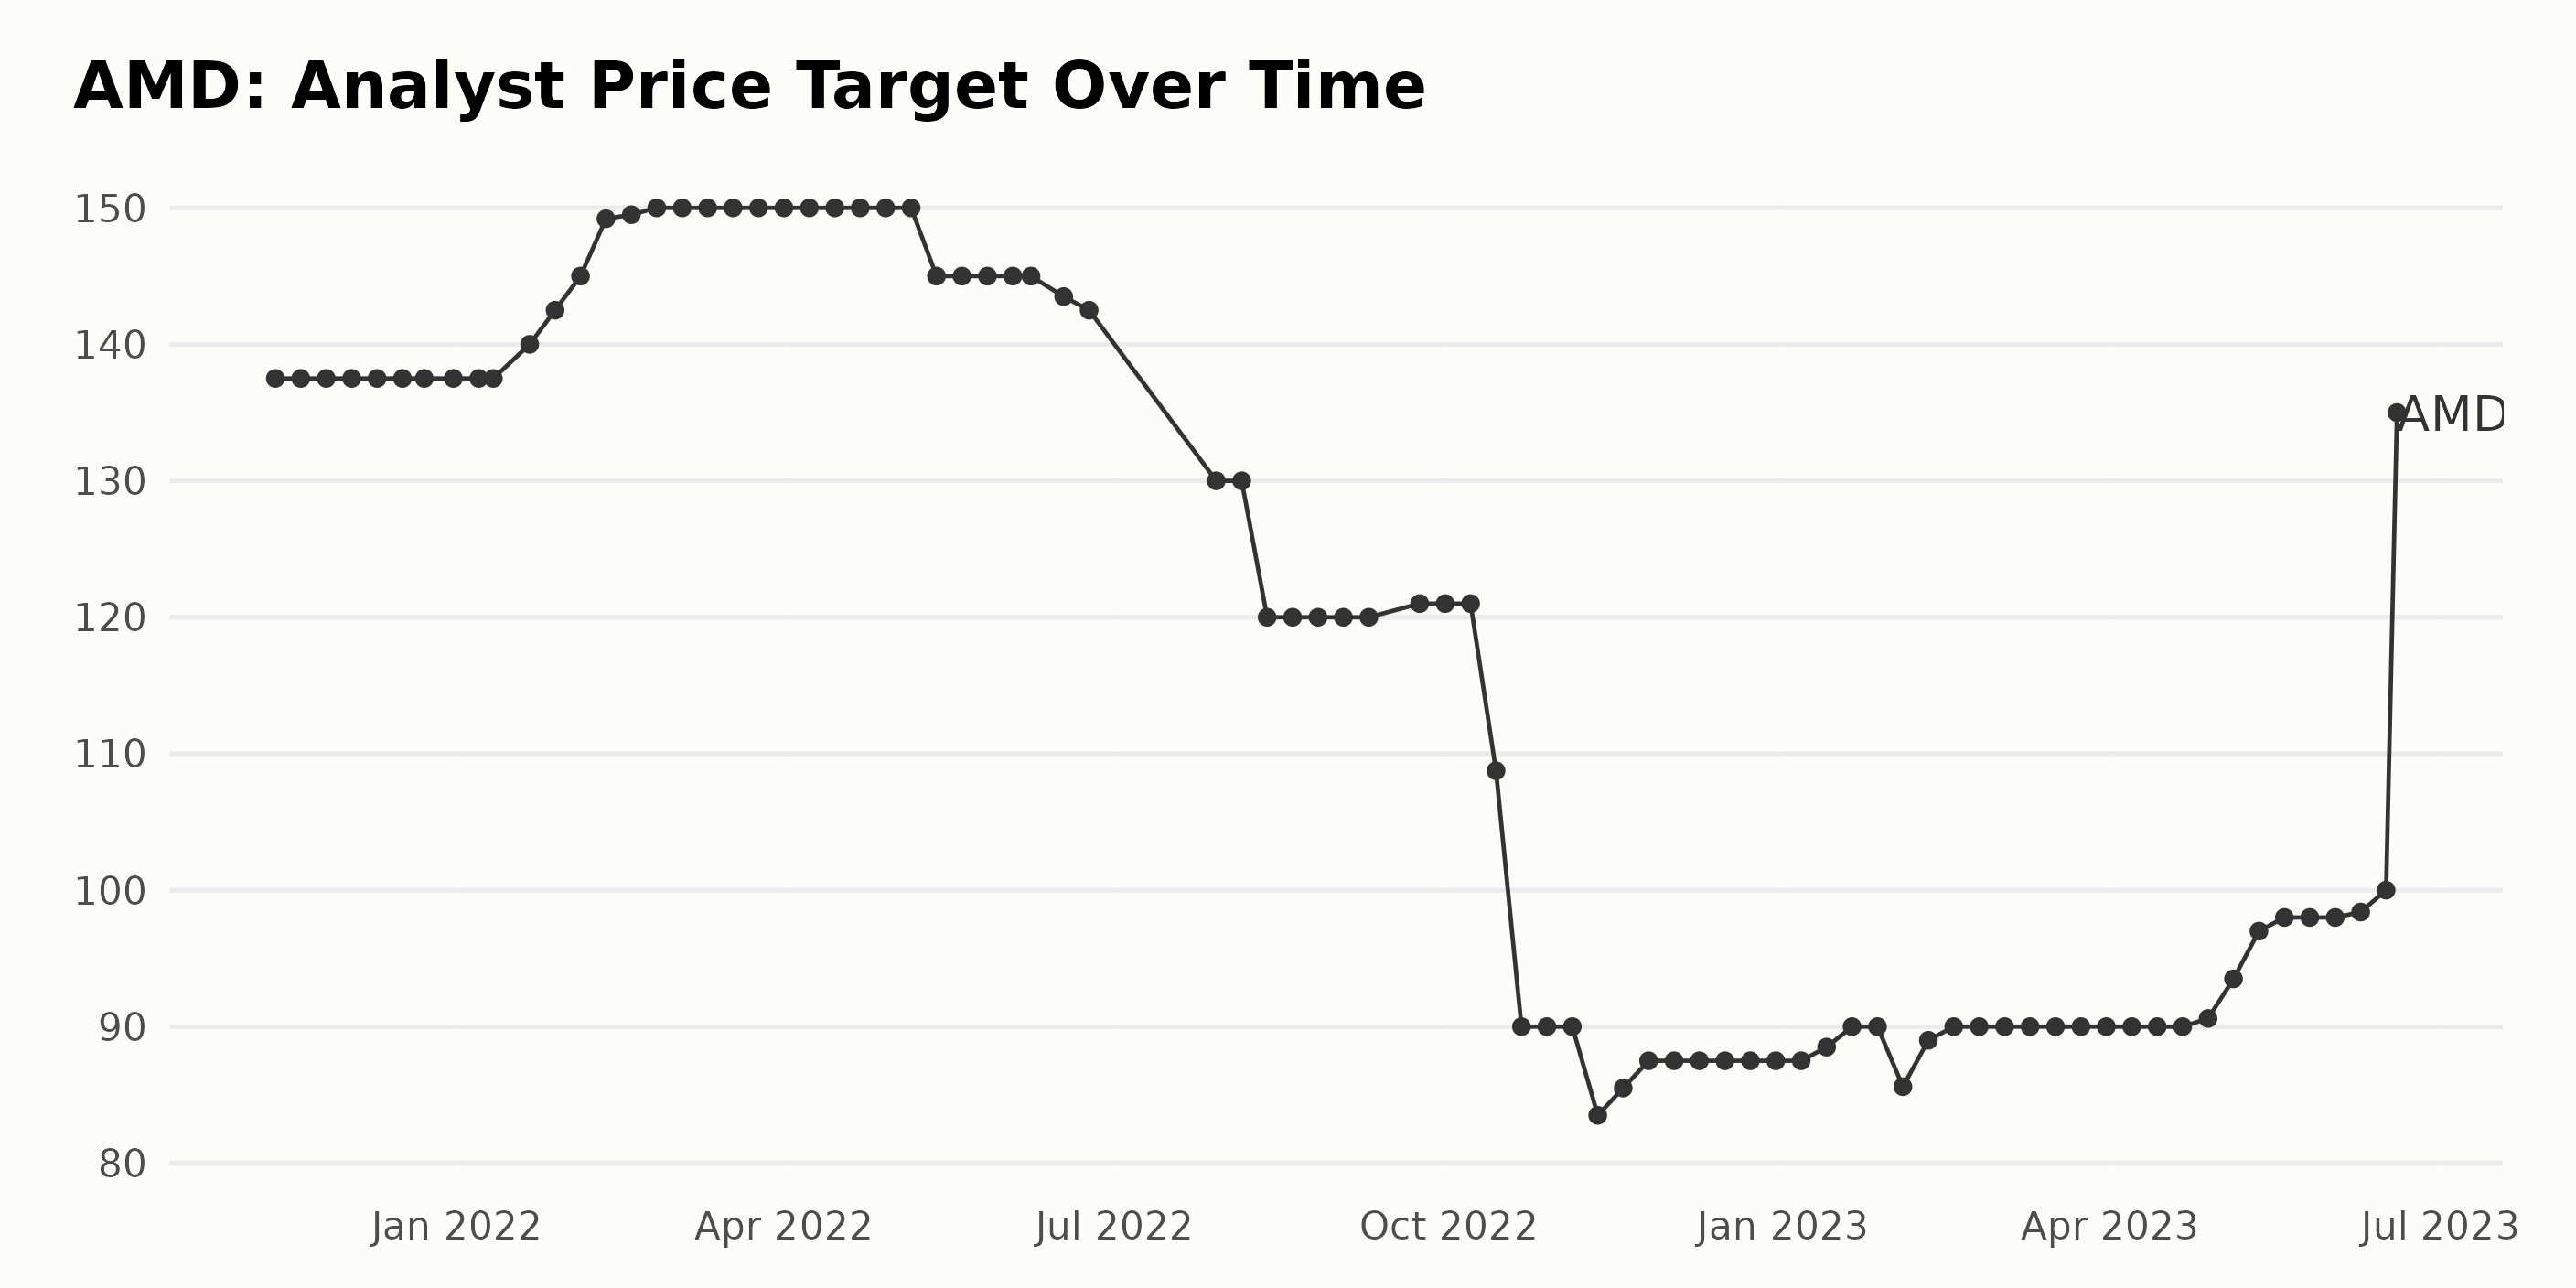
The trend and fluctuations of the Analyst Price Target for AMD indicate a dynamic change in target values over time. Here is a summary of key observations:
- Starting at $137.50 on November 12, 2021, the Analyst Price Target remained stable until January 21, 2022, when it increased to $140.
- The target gradually went up, hitting a peak value of $150 between February 25, 2022, and May 6, 2022, before declining to $130 on July 29, 2022.
- The target took a substantial dip in mid-October 2022, going down to $90 on October 21, 2022, and fluctuated around that value until February 3, 2023.
- From February 3, 2023, the Analyst Price Target experienced a gradual recovery, eventually reaching $135 on June 19, 2023.
From the first value of $137.5 on November 12, 2021, to the last value of $135 on June 19, 2023, the overall growth rate is approximately -1.82%.
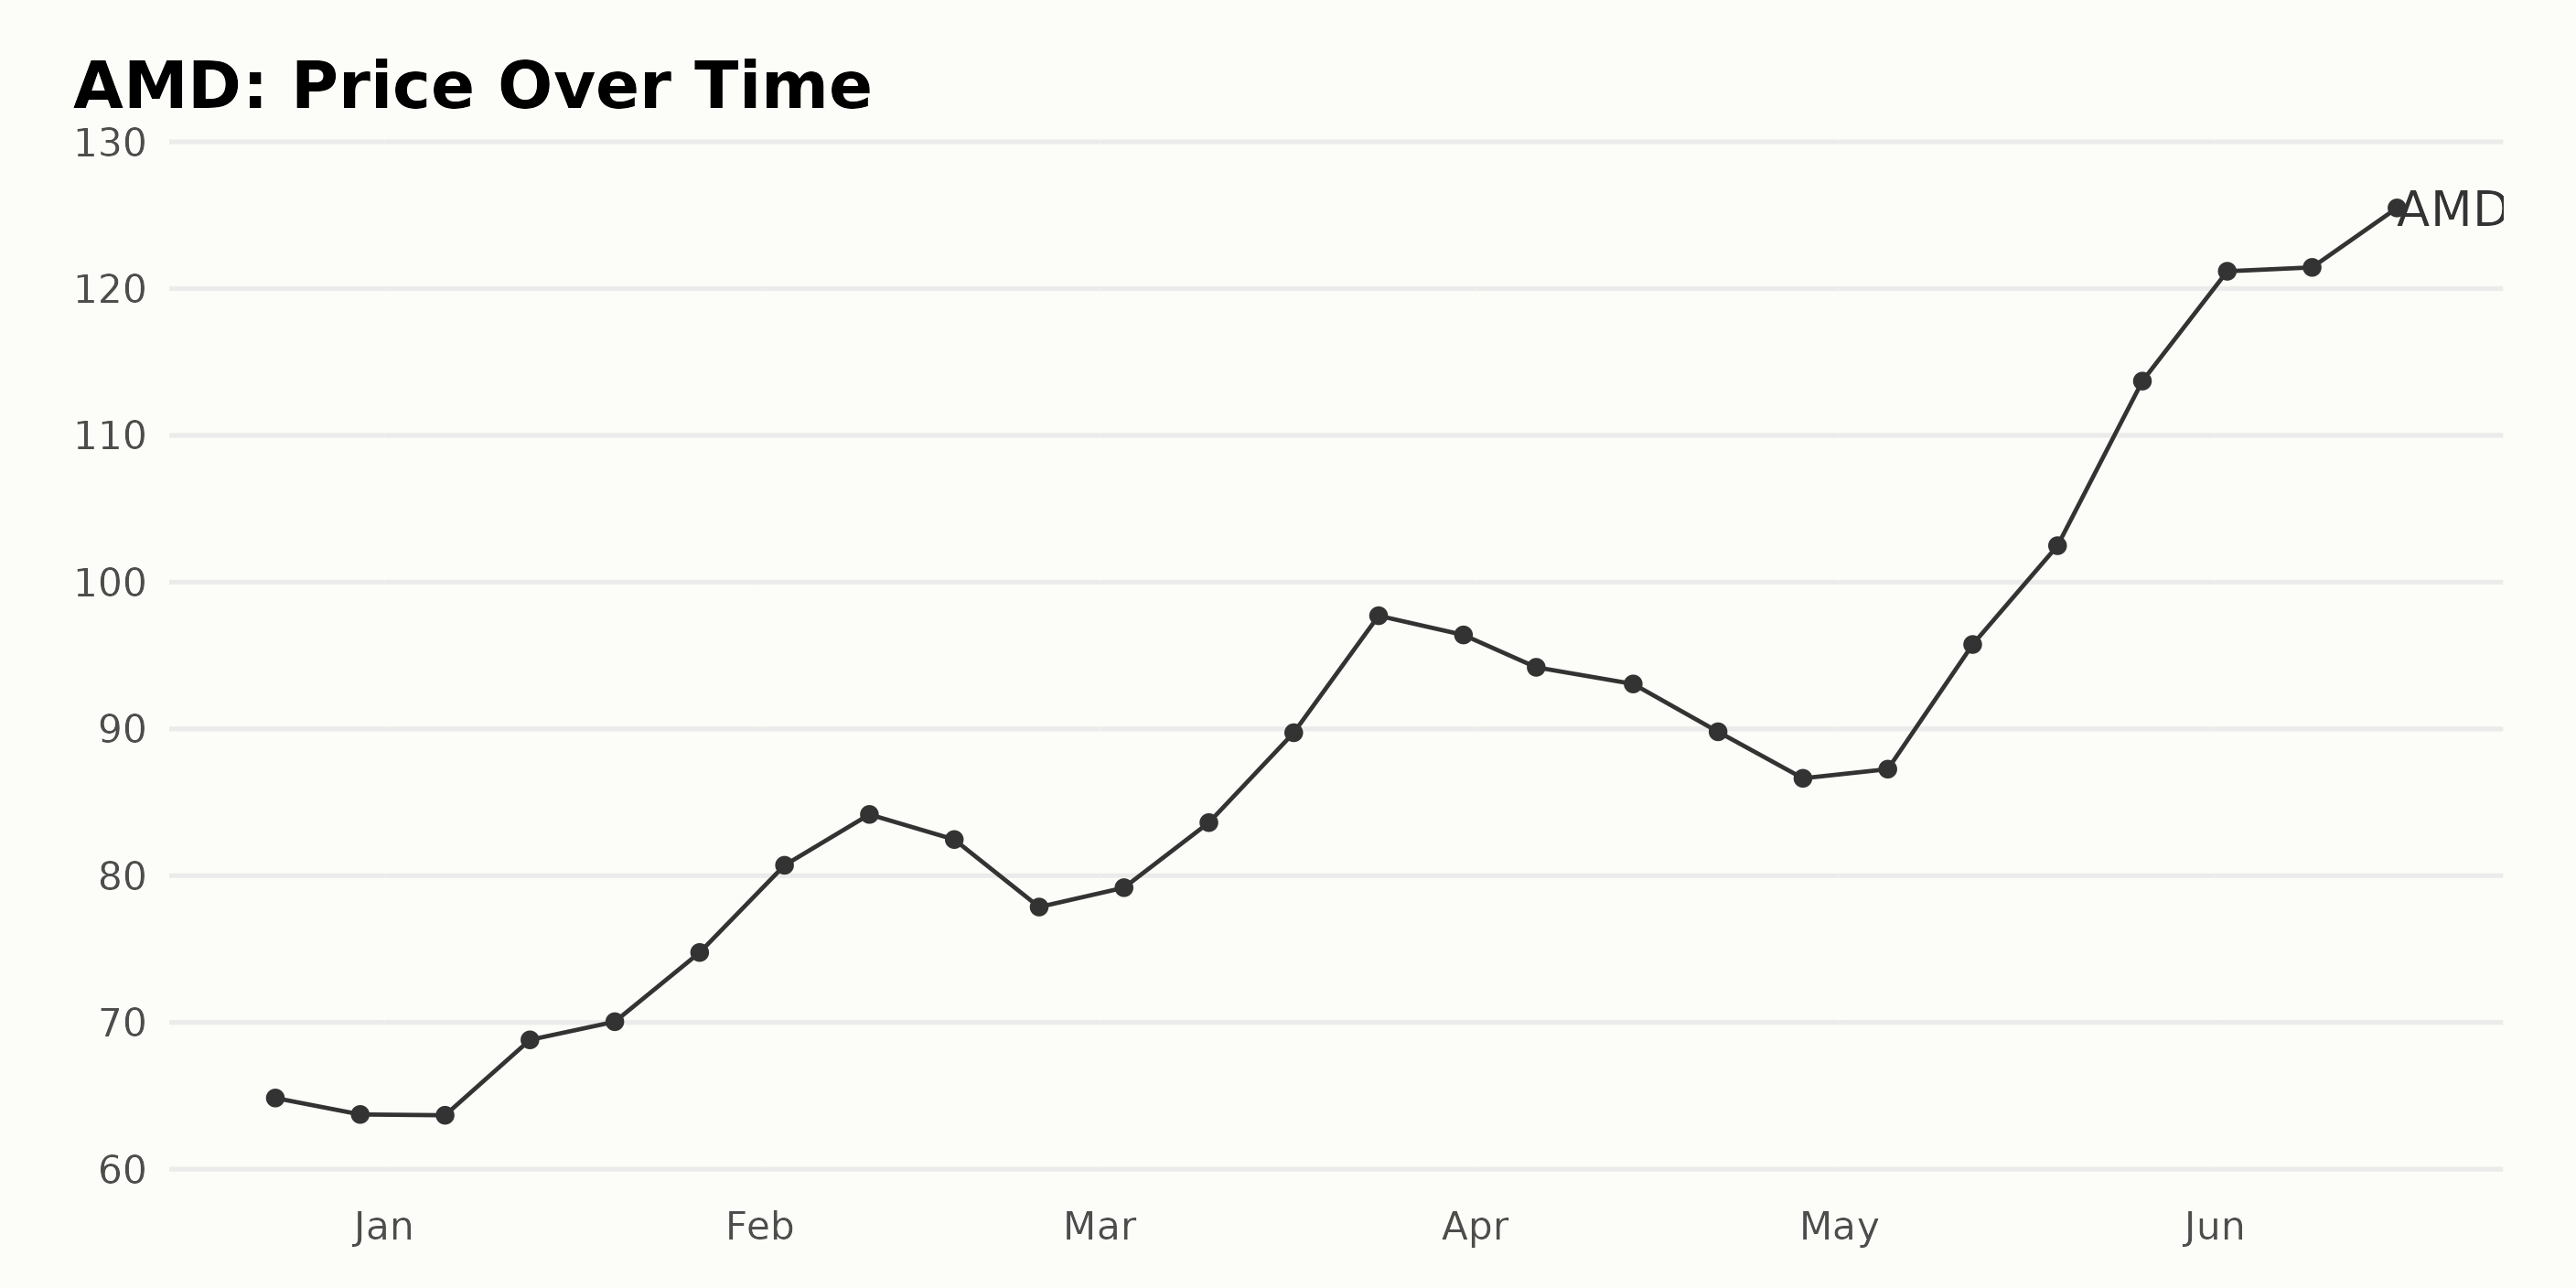
AMD Share Price Soars: Analyzing 6-Month Trend and Key Fluctuations
The trend observed from December 23, 2022, to June 16, 2023, showcases a significant overall increase in the share price. There are a few instances where the price dips temporarily but continues to rise afterward.
The growth rate appears to be accelerating from January to March 2023, with a slight deceleration in April, which then picks up again in May and June. Overall, the share price increased significantly from $64.85 on December 23, 2022, to $125.50 on June 16, 2023. Here is a chart of AMD’s price over the past 180 days.
Unfavorable POWR Ratings
AMD has an overall D rating, translating to a Sell in our POWR Ratings system. When comparing its performance to other stocks within the Semiconductor & Wireless Chip category, AMD remains in the lower ranks, occupying #85 out of 91 stocks. Throughout the analyzed period, AMD has consistently retained a “D” rating, showing little improvement in its rankings over time. Here are some key dates and corresponding rankings in the given timeframe:
- December 24, 2022: Rank 89
- January 21, 2023: Rank 90 (lowest rank in this period)
- February 25, 2023: Rank 86
- March 11, 2023: Rank 83 (highest rank in this period)
- April 22, 2023: Rank 85
- May 27, 2023: Rank 83
- June 17, 2023: Rank 85 (latest rank available)
In conclusion, AMD’s persistent “D” rating and inferior ranking within the Semiconductor & Wireless Chip category highlight an area of concern for investors and those interested in the stock’s potential growth.
Stocks to Consider Instead of Advanced Micro Devices Inc. (AMD)
Other stocks in the Semiconductor & Wireless Chip sector that may be worth considering are SUMCO Corporation (SUOPY), Infineon Technologies AG (IFNNY), and Renesas Electronics Corporation (RNECF) -- they have better POWR Ratings.
What To Do Next?
Discover 10 widely held stocks that our proprietary model shows have tremendous downside potential. Please make sure none of these “death trap” stocks are lurking in your portfolio:
AMD shares were trading at $120.08 per share on Monday afternoon, down $4.16 (-3.35%). Year-to-date, AMD has gained 85.39%, versus a 15.35% rise in the benchmark S&P 500 index during the same period.
About the Author: Subhasree Kar

Subhasree’s keen interest in financial instruments led her to pursue a career as an investment analyst. After earning a Master’s degree in Economics, she gained knowledge of equity research and portfolio management at Finlatics.
The post Buy or Sell this Week: Advanced Micro Devices (AMD) appeared first on StockNews.com