
Chart of the Day: Zillow Group (Z)
Zillow Group, Inc. (Z) engages in the provision of real estate and home-related information marketplaces on mobile and the web. The company has the largest real estate portal in North America. Real estate agents and brokers use Z to generate leads through advertisement.
Z is embarking on what it calls “Real Estate” 2.0”. This initiative should smooth the way for more transactions by helping sellers sell their homes by providing liquidity to homeowners and helping them run virtual tours on Z’s site. These transactions could lead to more services for Z such as mortgages and title insurance. These services could lead to significantly more profits for the company.
The stock is currently trading at $62 which is more than double its March low.
The Tale of the Tape:
Take a look at the 1-year chart of Zillow below with my added notations:
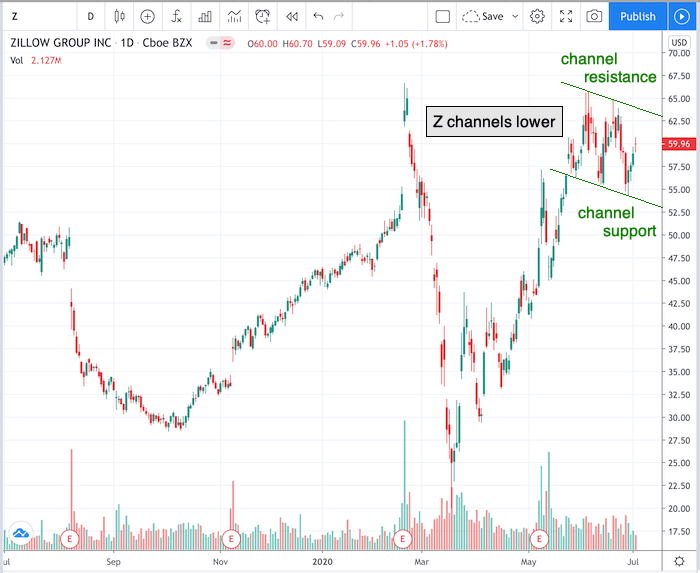
Chart of Z provided by TradingView
Z has formed a down-channel over the past two months. A channel is simply formed through the combination of a trend line support that runs parallel to a trend line resistance. Think of it by connecting the lower highs and lower lows of a stock’s price with parallel trendlines to show a downward trend. The space between those trendlines is the descending channel.
When it comes to channels, remember that any 3 points can start the channel, but a 4th point or more, confirms it. You can see that Z has tested its channel trendlines multiple times. You could enter a long position on a pullback down to the channel support, or on a breakthrough of the channel resistance. If/when the channel resistance is broken, often a breakout to the upside occurs.
Before making any trading decision, decide which side of the trade you believe gives you the highest probability of success. Do you prefer the short side of the market, long side, or do you want to be in the market at all? If you haven’t thought about it, review the overall indices themselves. For example, take a look at the S&P 500. Is it trending higher or lower? Has it recently broken through a key resistance or support level? Making these decisions ahead of time will help you decide which side of the trade you believe gives you the best opportunities.
No matter what your strategy or when you decide to enter, always remember to use protective stops and you’ll be around for the next trade. Capital preservation is always key!
Good luck!
Christian Tharp, CMT
@cmtstockcoach
Stock Trading & Investing for Everyone
Z shares were trading at $61.28 per share on Monday morning, up $1.32 (+2.20%). Year-to-date, Z has declined N/A%, versus a -0.73% rise in the benchmark S&P 500 index during the same period.
About the Author: Christian Tharp

Christian is an expert stock market coach at the Adam Mesh Trading Group who has mentored more than 4,000 traders and investors. He is a professional technical analyst that is a certified Chartered Market Technician (CMT), which is a designation awarded by the CMT Association. Christian is also the author of the daily online newsletter Todays Big Stock.
The post Chart of the Day: Zillow Group (Z) appeared first on StockNews.com