


Senior living provider The Pennant Group (NASDAQ: PNTG) reported revenue ahead of Wall Street’s expectations in Q4 CY2025, with sales up 53.3% year on year to $289.3 million. The company expects the full year’s revenue to be around $1.15 billion, close to analysts’ estimates. Its non-GAAP profit of $0.34 per share was 7.7% above analysts’ consensus estimates.
Is now the time to buy The Pennant Group? Find out by accessing our full research report, it’s free.
The Pennant Group (PNTG) Q4 CY2025 Highlights:
- Revenue: $289.3 million vs analyst estimates of $275.2 million (53.3% year-on-year growth, 5.1% beat)
- Adjusted EPS: $0.34 vs analyst estimates of $0.32 (7.7% beat)
- Adjusted EBITDA: $22.37 million vs analyst estimates of $22.07 million (7.7% margin, 1.4% beat)
- Adjusted EPS guidance for the upcoming financial year 2026 is $1.31 at the midpoint
- EBITDA guidance for the upcoming financial year 2026 is $91.3 million at the midpoint, below analyst estimates of $93.76 million
- Operating Margin: 6%, up from 4.9% in the same quarter last year
- Sales Volumes rose 81.3% year on year (-63.3% in the same quarter last year)
- Market Capitalization: $1.11 billion
“2025 was a year of record-breaking performance and growth for Pennant,” said Brent Guerisoli, the Company’s Chief Executive Officer.
Company Overview
Spun off from The Ensign Group in 2019 to focus on non-skilled nursing healthcare services, Pennant Group (NASDAQ: PNTG) operates home health, hospice, and senior living facilities across 13 western and midwestern states, serving patients of all ages including seniors.
Revenue Growth
Reviewing a company’s long-term sales performance reveals insights into its quality. Any business can experience short-term success, but top-performing ones enjoy sustained growth for years. Over the last five years, The Pennant Group grew its sales at an impressive 19.8% compounded annual growth rate. Its growth beat the average healthcare company and shows its offerings resonate with customers.
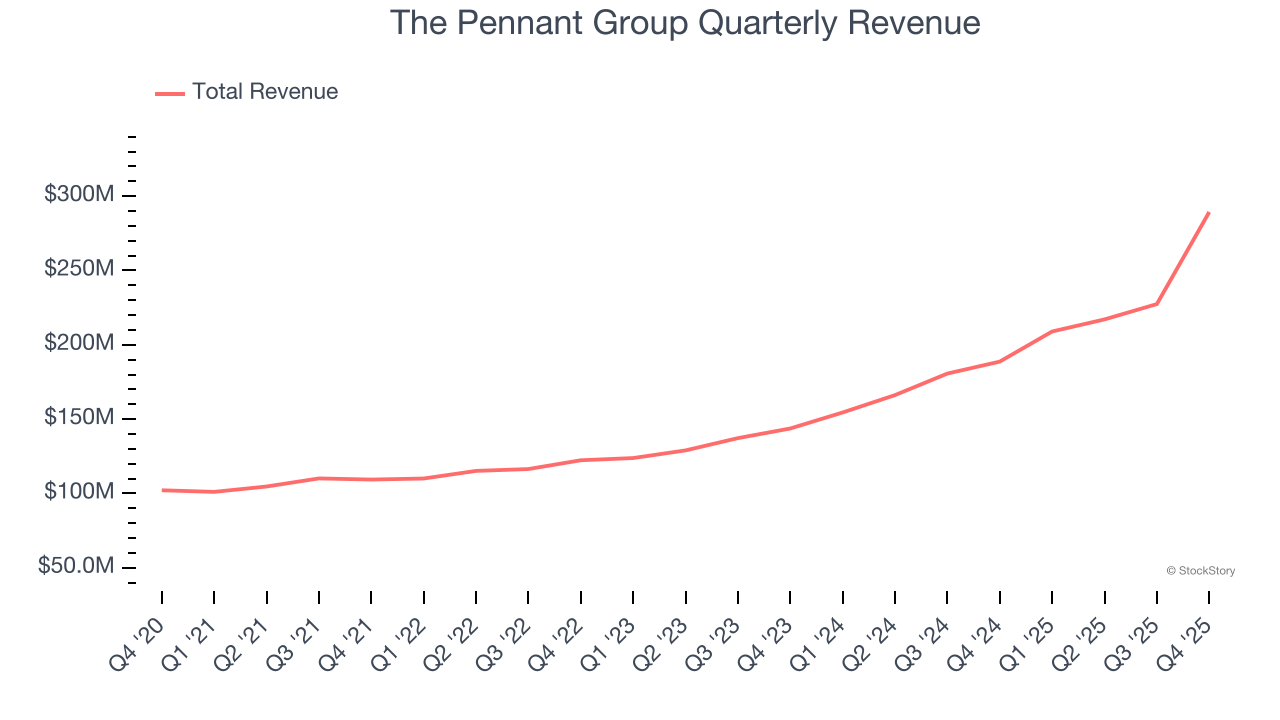
We at StockStory place the most emphasis on long-term growth, but within healthcare, a half-decade historical view may miss recent innovations or disruptive industry trends. The Pennant Group’s annualized revenue growth of 32.9% over the last two years is above its five-year trend, suggesting its demand was strong and recently accelerated. 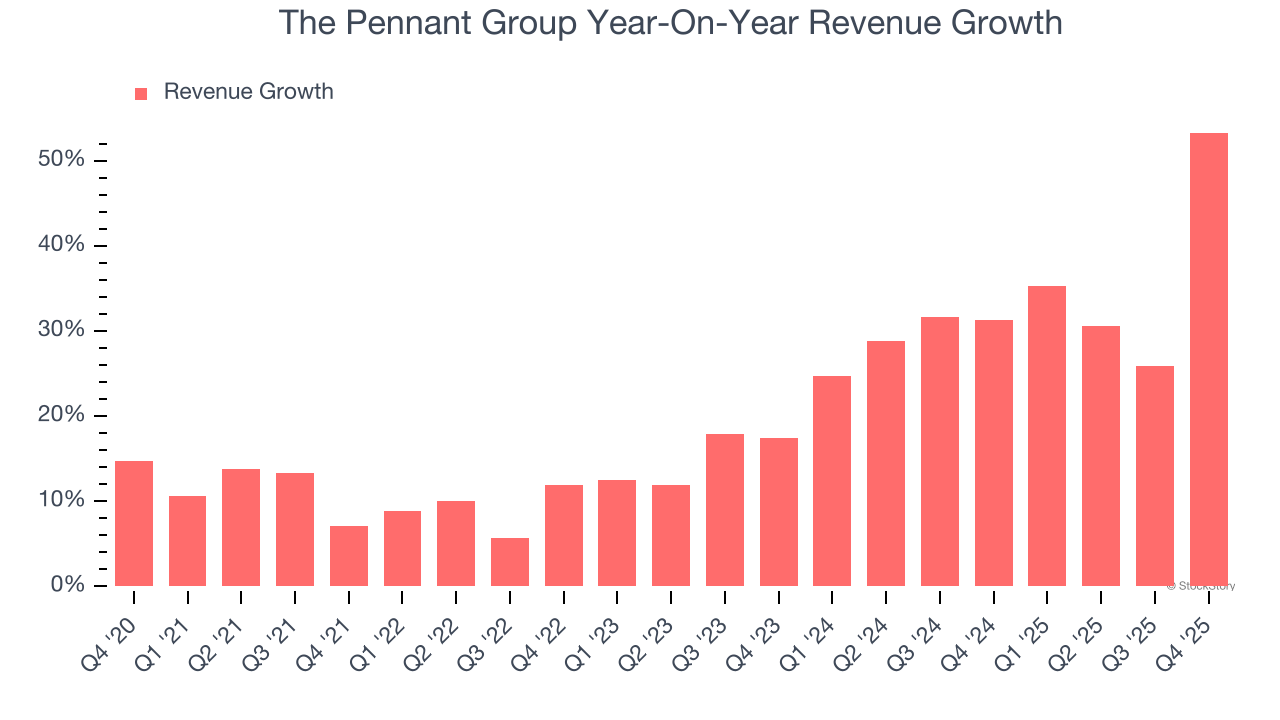
We can better understand the company’s revenue dynamics by analyzing its number of admissions, which reached 28,941 in the latest quarter. Over the last two years, The Pennant Group’s admissions averaged 12.5% year-on-year growth. Because this number is lower than its revenue growth, we can see the company benefited from price increases. 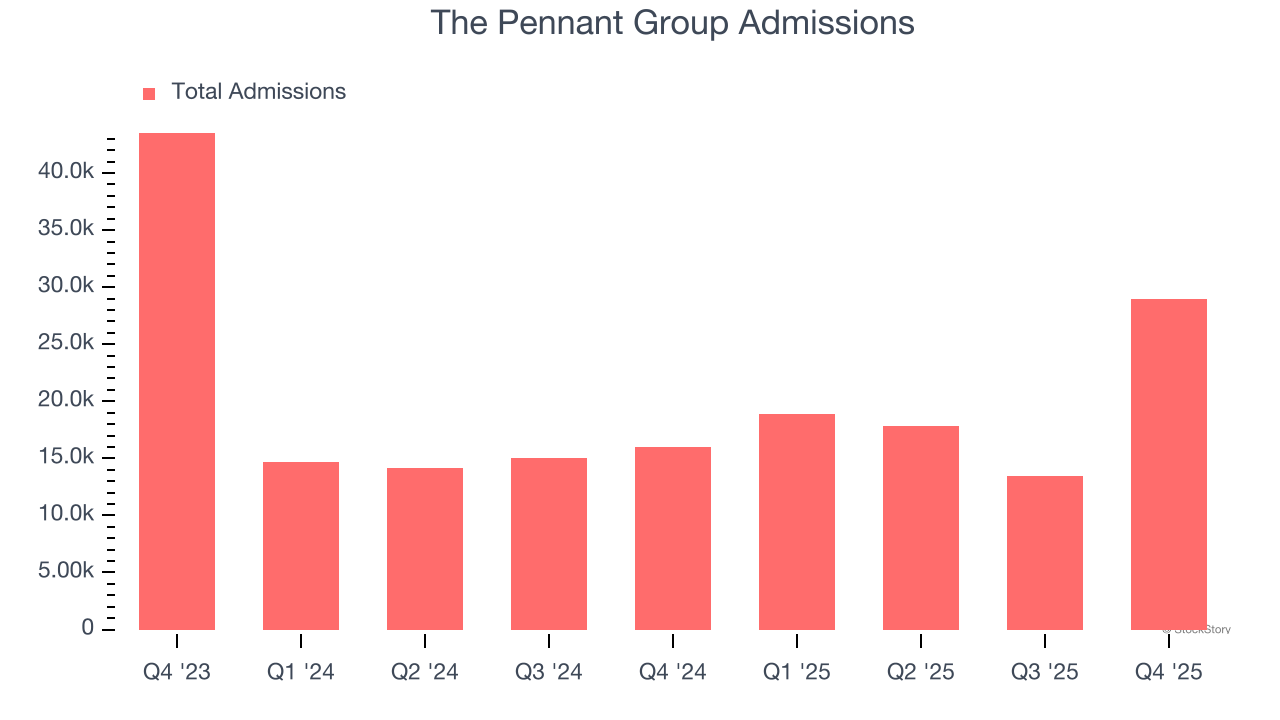
This quarter, The Pennant Group reported magnificent year-on-year revenue growth of 53.3%, and its $289.3 million of revenue beat Wall Street’s estimates by 5.1%.
Looking ahead, sell-side analysts expect revenue to grow 22.4% over the next 12 months, a deceleration versus the last two years. Still, this projection is commendable and implies the market sees success for its products and services.
Microsoft, Alphabet, Coca-Cola, Monster Beverage—all began as under-the-radar growth stories riding a massive trend. We’ve identified the next one: a profitable AI semiconductor play Wall Street is still overlooking. Go here for access to our full report.
Operating Margin
The Pennant Group was profitable over the last five years but held back by its large cost base. Its average operating margin of 4.7% was weak for a healthcare business.
On the plus side, The Pennant Group’s operating margin rose by 3.7 percentage points over the last five years, as its sales growth gave it operating leverage.
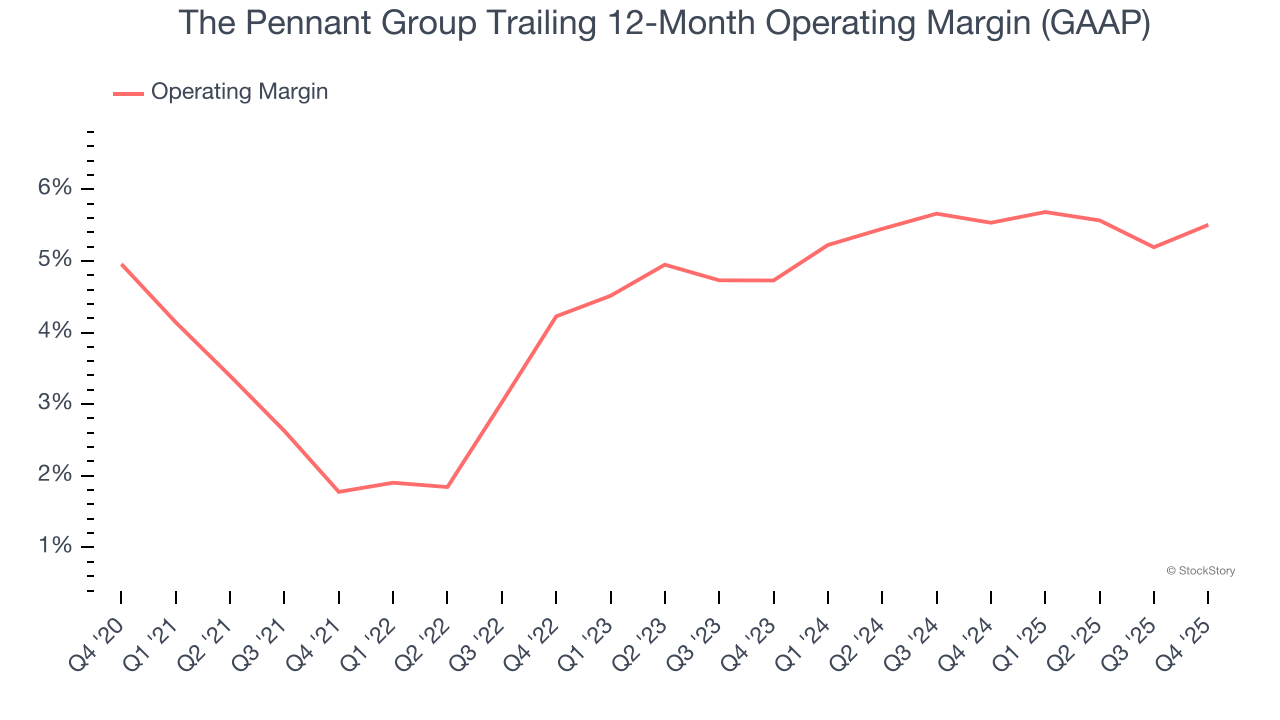
In Q4, The Pennant Group generated an operating margin profit margin of 6%, up 1.1 percentage points year on year. This increase was a welcome development and shows it was more efficient.
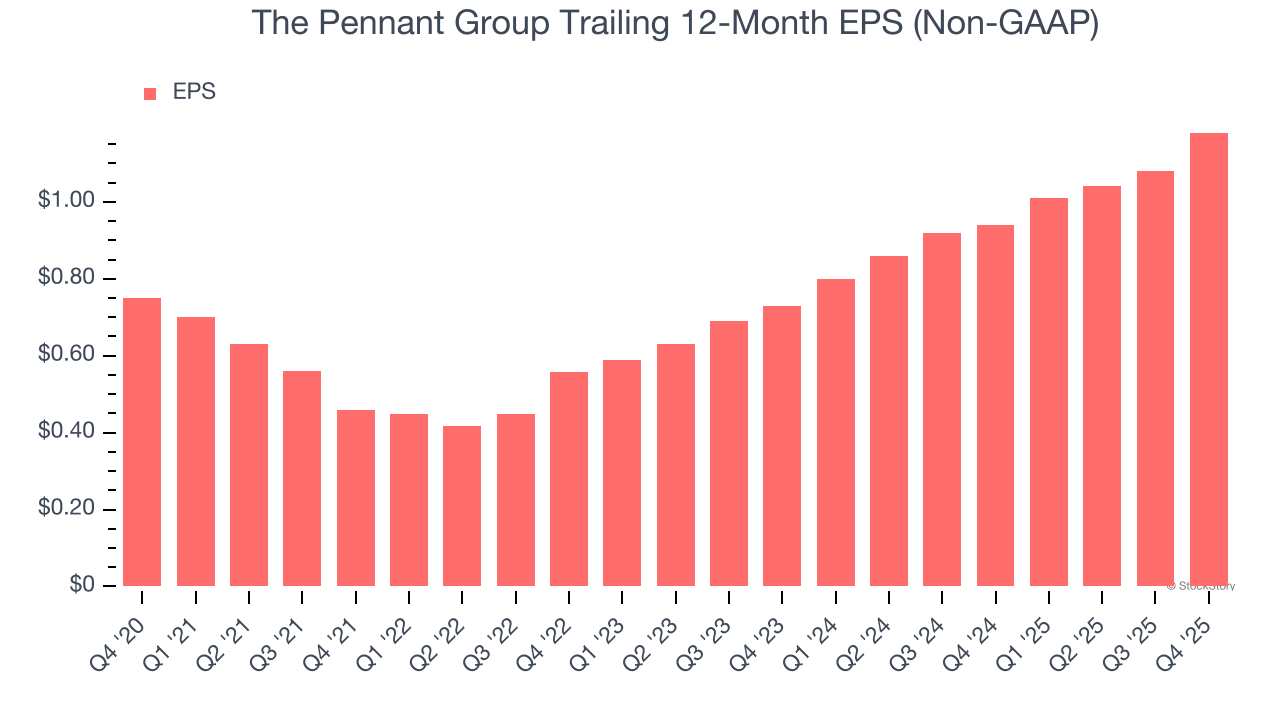
Earnings Per Share
Revenue trends explain a company’s historical growth, but the long-term change in earnings per share (EPS) points to the profitability of that growth – for example, a company could inflate its sales through excessive spending on advertising and promotions.
The Pennant Group’s EPS grew at a remarkable 9.5% compounded annual growth rate over the last five years. Despite its operating margin improvement during that time, this performance was lower than its 19.8% annualized revenue growth, telling us that non-fundamental factors such as interest and taxes affected its ultimate earnings.
We can take a deeper look into The Pennant Group’s earnings to better understand the drivers of its performance. A five-year view shows The Pennant Group has diluted its shareholders, growing its share count by 15.3%. This dilution overshadowed its increased operational efficiency and has led to lower per share earnings. Taxes and interest expenses can also affect EPS but don’t tell us as much about a company’s fundamentals. 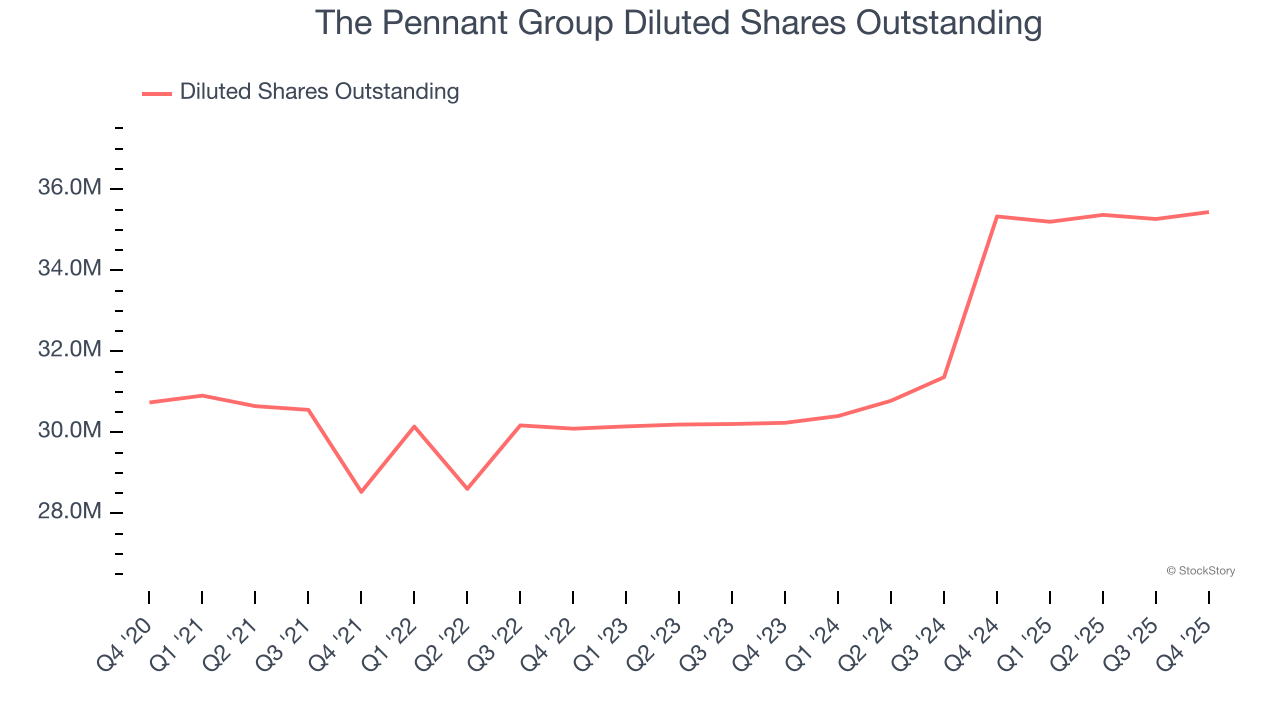
In Q4, The Pennant Group reported adjusted EPS of $0.34, up from $0.24 in the same quarter last year. This print beat analysts’ estimates by 7.7%. Over the next 12 months, Wall Street expects The Pennant Group’s full-year EPS of $1.18 to grow 10%.
Key Takeaways from The Pennant Group’s Q4 Results
We were impressed by how significantly The Pennant Group blew past analysts’ revenue expectations this quarter. We were also glad its EPS outperformed Wall Street’s estimates. On the other hand, its full-year EBITDA guidance missed. Overall, this print had some key positives. Investors were likely hoping for more, and shares traded down 3.2% to $32.03 immediately after reporting.
So should you invest in The Pennant Group right now? When making that decision, it’s important to consider its valuation, business qualities, as well as what has happened in the latest quarter. We cover that in our actionable full research report which you can read here (it’s free).


