


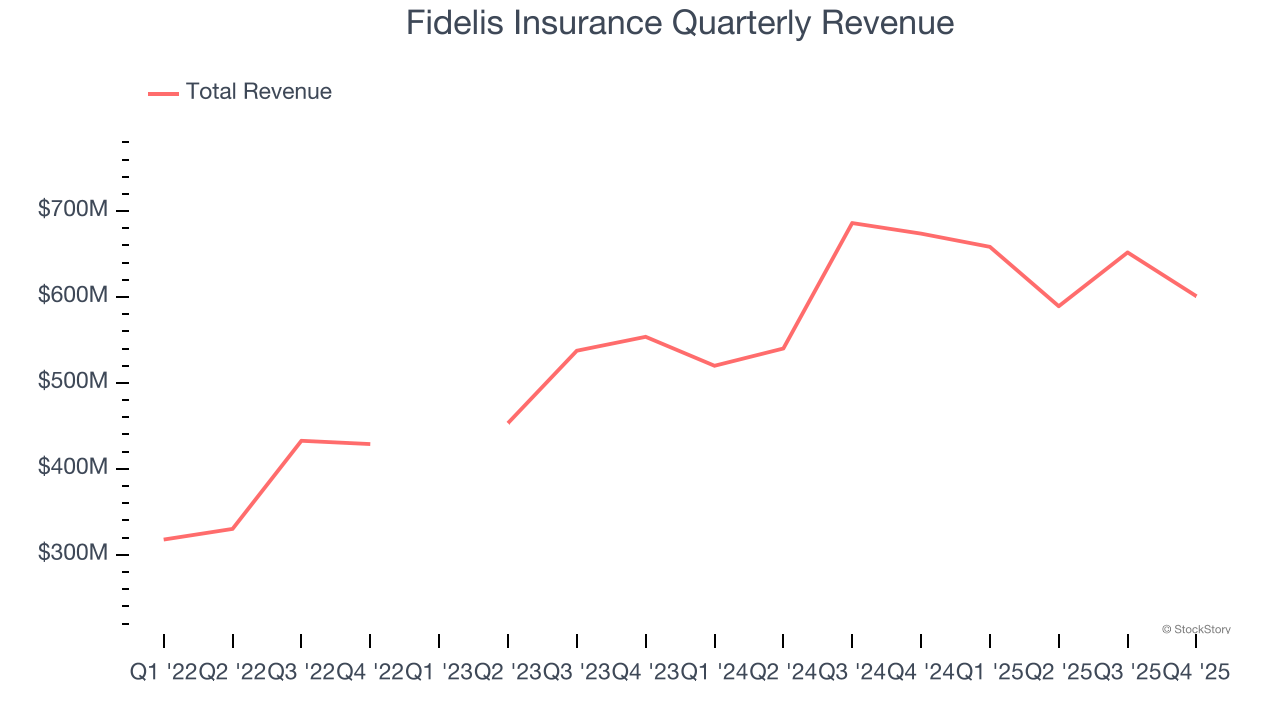
Specialty insurance provider Fidelis Insurance (NYSE: FIHL) missed Wall Street’s revenue expectations in Q4 CY2025, with sales falling 10.8% year on year to $600.9 million. Its non-GAAP profit of $1.09 per share was 1.3% above analysts’ consensus estimates.
Is now the time to buy Fidelis Insurance? Find out by accessing our full research report, it’s free.
Fidelis Insurance (FIHL) Q4 CY2025 Highlights:
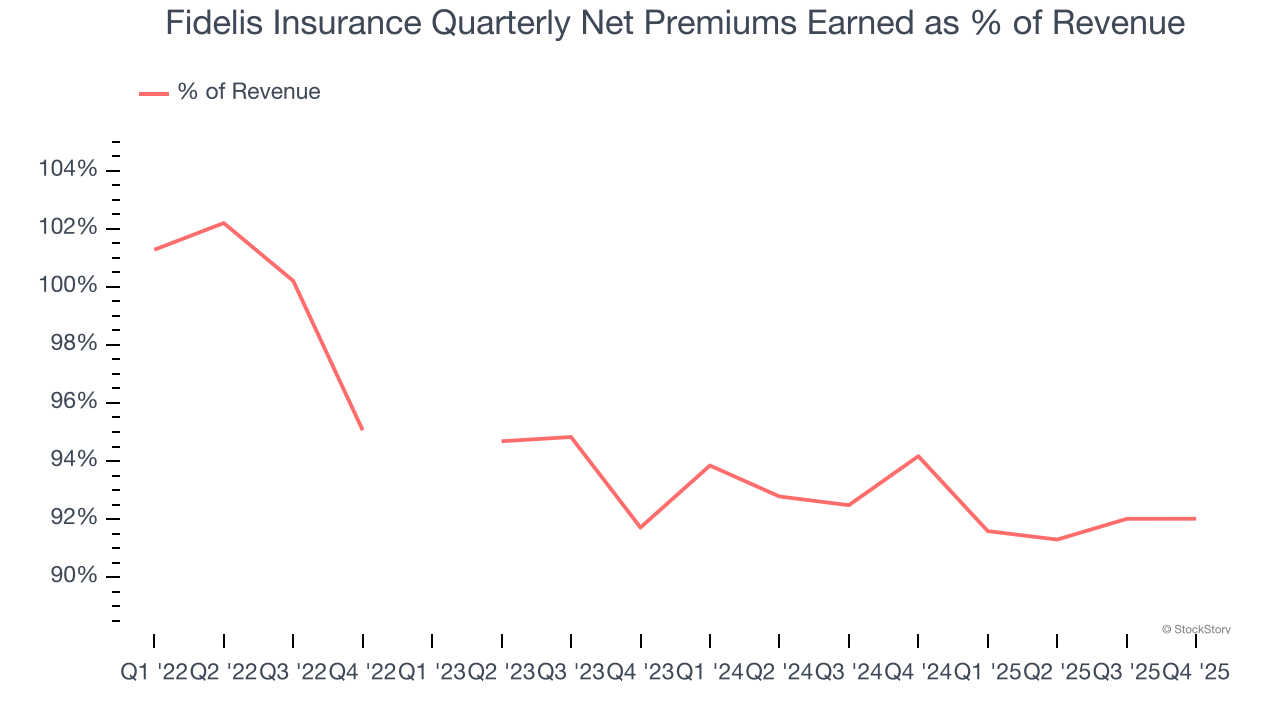
- Net Premiums Earned: $552.9 million vs analyst estimates of $621.3 million (12.9% year-on-year decline, 11% miss)
- Revenue: $600.9 million vs analyst estimates of $706.8 million (10.8% year-on-year decline, 15% miss)
- Combined Ratio: 80.6% vs analyst estimates of 84.5% (390 basis point beat)
- Adjusted EPS: $1.09 vs analyst estimates of $1.08 (1.3% beat)
- Book Value per Share: $24.61 vs analyst estimates of $24.51 (12.3% year-on-year growth, in line)
- Market Capitalization: $2.07 billion
Dan Burrows, Group Chief Executive Officer of Fidelis Insurance Group, commented: “Our excellent fourth quarter performance, highlighted by an 80.6% combined ratio and an annualized Operating ROAE of 18.3%, once again demonstrates the strength of our platform and our ability to deliver on our targets as we execute our capital allocation strategy.
Company Overview
Founded in Bermuda in 2014 and designed to adapt nimbly to evolving market conditions, Fidelis Insurance (NYSE: FIHL) is a global specialty insurance and reinsurance company focused on creating value through strategic capital allocation, expert risk selection and a network of long-term underwriting partnerships.
Revenue Growth
Insurers earn revenue three ways. The core insurance business itself, often called underwriting and represented in the income statement as premiums earned, is one way. Investment income from investing the “float” (premiums collected upfront not yet paid out as claims) in assets such as fixed-income assets and equities is the second way. Fees from various sources such as policy administration, annuities, or other value-added services is the third. Luckily, Fidelis Insurance’s revenue grew at an incredible 24.4% compounded annual growth rate over the last three years. Its growth beat the average insurance company and shows its offerings resonate with customers, a helpful starting point for our analysis.
 Note: Quarters not shown were determined to be outliers, impacted by outsized investment gains/losses that are not indicative of the recurring fundamentals of the business.
We at StockStory place the most emphasis on long-term growth, but within financials, a stretched historical view may miss recent interest rate changes, market returns, and industry trends. Fidelis Insurance’s annualized revenue growth of 9.2% over the last two years is below its three-year trend, but we still think the results suggest healthy demand. 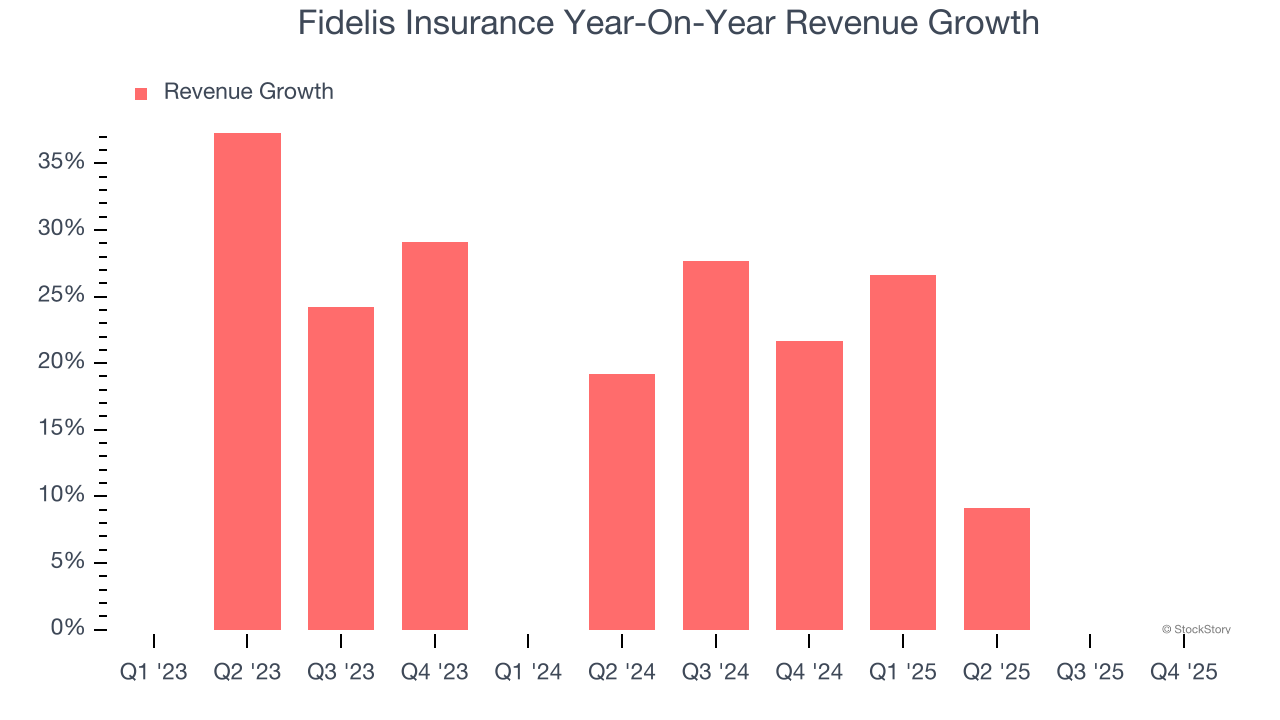 Note: Quarters not shown were determined to be outliers, impacted by outsized investment gains/losses that are not indicative of the recurring fundamentals of the business.
This quarter, Fidelis Insurance missed Wall Street’s estimates and reported a rather uninspiring 10.8% year-on-year revenue decline, generating $600.9 million of revenue.
Net premiums earned made up 78.6% of the company’s total revenue during the last four years, meaning insurance operations are Fidelis Insurance’s largest source of revenue.
 Note: Quarters not shown were determined to be outliers, impacted by outsized investment gains/losses that are not indicative of the recurring fundamentals of the business.
Markets consistently prioritize net premiums earned growth over investment and fee income, recognizing its superior quality as a core indicator of the company’s underwriting success and market penetration.
Microsoft, Alphabet, Coca-Cola, Monster Beverage—all began as under-the-radar growth stories riding a massive trend. We’ve identified the next one: a profitable AI semiconductor play Wall Street is still overlooking. Go here for access to our full report.
Book Value Per Share (BVPS)
Insurers are balance sheet businesses, collecting premiums upfront and paying out claims over time. Premiums collected but not yet paid out, often referred to as the float, are invested and create an asset base supported by a liability structure. Book value per share (BVPS) captures this dynamic by measuring these assets (investment portfolio, cash, reinsurance recoverables) less liabilities (claim reserves, debt, future policy benefits). BVPS is essentially the residual value for shareholders.
We therefore consider BVPS very important to track for insurers and a metric that sheds light on business quality. While other (and more commonly known) per-share metrics like EPS can sometimes be lumpy due to reserve releases or one-time items and can be managed or skewed while still following accounting rules, BVPS reflects long-term capital growth and is harder to manipulate.
To the detriment of investors, Fidelis Insurance’s BVPS grew at a tepid 8.8% annual clip over the last two years.
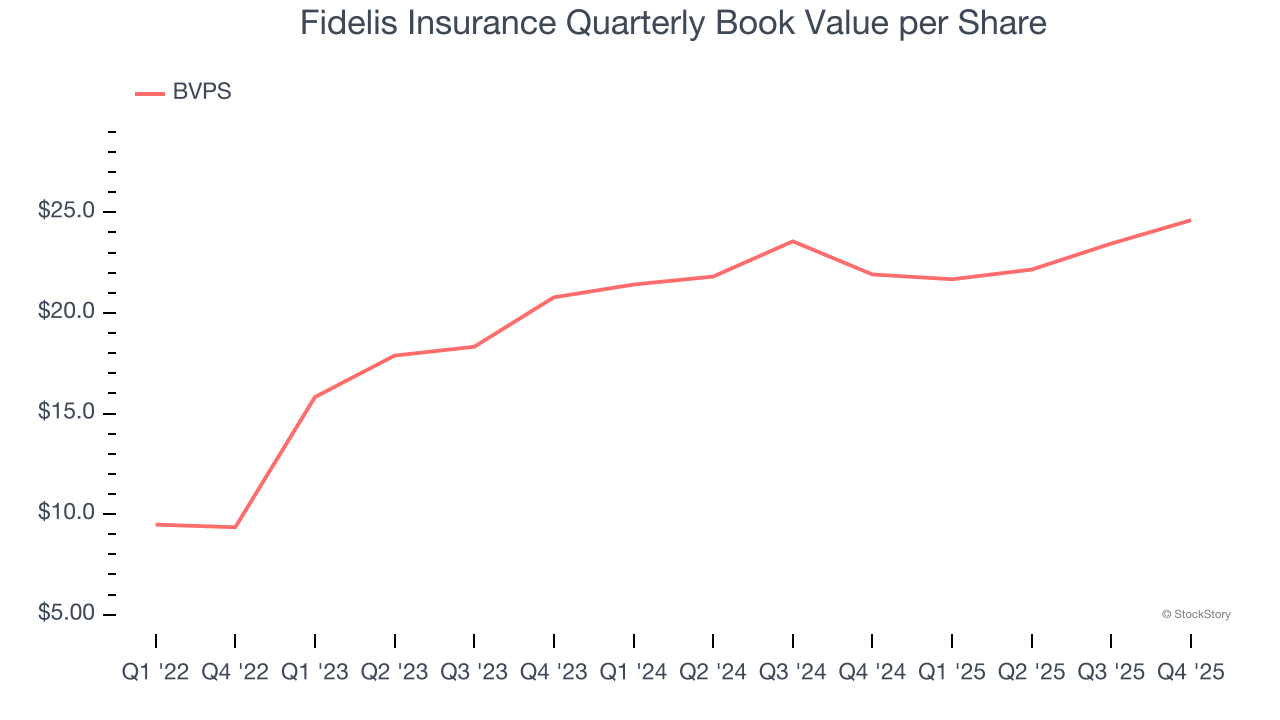
Over the next 12 months, Consensus estimates call for Fidelis Insurance’s BVPS to grow by 30% to $24.51, elite growth rate.
Key Takeaways from Fidelis Insurance’s Q4 Results
We struggled to find many positives in these results. Its revenue missed and its net premiums earned fell short of Wall Street’s estimates. Overall, this quarter could have been better. The stock remained flat at $20.10 immediately following the results.
So should you invest in Fidelis Insurance right now? What happened in the latest quarter matters, but not as much as longer-term business quality and valuation, when deciding whether to invest in this stock. We cover that in our actionable full research report which you can read here (it’s free).


