


Safety and specialty services provider APi (NYSE: APG) beat Wall Street’s revenue expectations in Q4 CY2024, with sales up 5.8% year on year to $1.86 billion. On the other hand, next quarter’s revenue guidance of $1.65 billion was less impressive, coming in 4.4% below analysts’ estimates. Its non-GAAP profit of $0.51 per share was 2.6% above analysts’ consensus estimates.
Is now the time to buy APi? Find out by accessing our full research report, it’s free.
APi (APG) Q4 CY2024 Highlights:
- Revenue: $1.86 billion vs analyst estimates of $1.84 billion (5.8% year-on-year growth, 1.2% beat)
- Adjusted EPS: $0.51 vs analyst estimates of $0.50 (2.6% beat)
- Adjusted EBITDA: $242 million vs analyst estimates of $241.7 million (13% margin, in line)
- Management’s revenue guidance for the upcoming financial year 2025 is $7.4 billion at the midpoint, in line with analyst expectations and implying 5.4% growth (vs 1.3% in FY2024)
- EBITDA guidance for the upcoming financial year 2025 is $995 million at the midpoint, in line with analyst expectations
- Operating Margin: 6.2%, up from 4.3% in the same quarter last year
- Free Cash Flow Margin: 14.2%, down from 15.6% in the same quarter last year
- Organic Revenue rose 1.3% year on year, in line with the same quarter last year
- Market Capitalization: $11.13 billion
Company Overview
Started in 1926 as an insulation contractor, APi (NYSE: APG) provides life safety solutions and specialty services for buildings and infrastructure.
Construction and Maintenance Services
Construction and maintenance services companies not only boast technical know-how in specialized areas but also may hold special licenses and permits. Those who work in more regulated areas can enjoy more predictable revenue streams - for example, fire escapes need to be inspected every five years–. More recently, services to address energy efficiency and labor availability are also creating incremental demand. But like the broader industrials sector, construction and maintenance services companies are at the whim of economic cycles as external factors like interest rates can greatly impact the new construction that drives incremental demand for these companies’ offerings.
Sales Growth
Reviewing a company’s long-term sales performance reveals insights into its quality. Any business can have short-term success, but a top-tier one grows for years. Luckily, APi’s sales grew at an excellent 13% compounded annual growth rate over the last five years. Its growth beat the average industrials company and shows its offerings resonate with customers, a helpful starting point for our analysis.
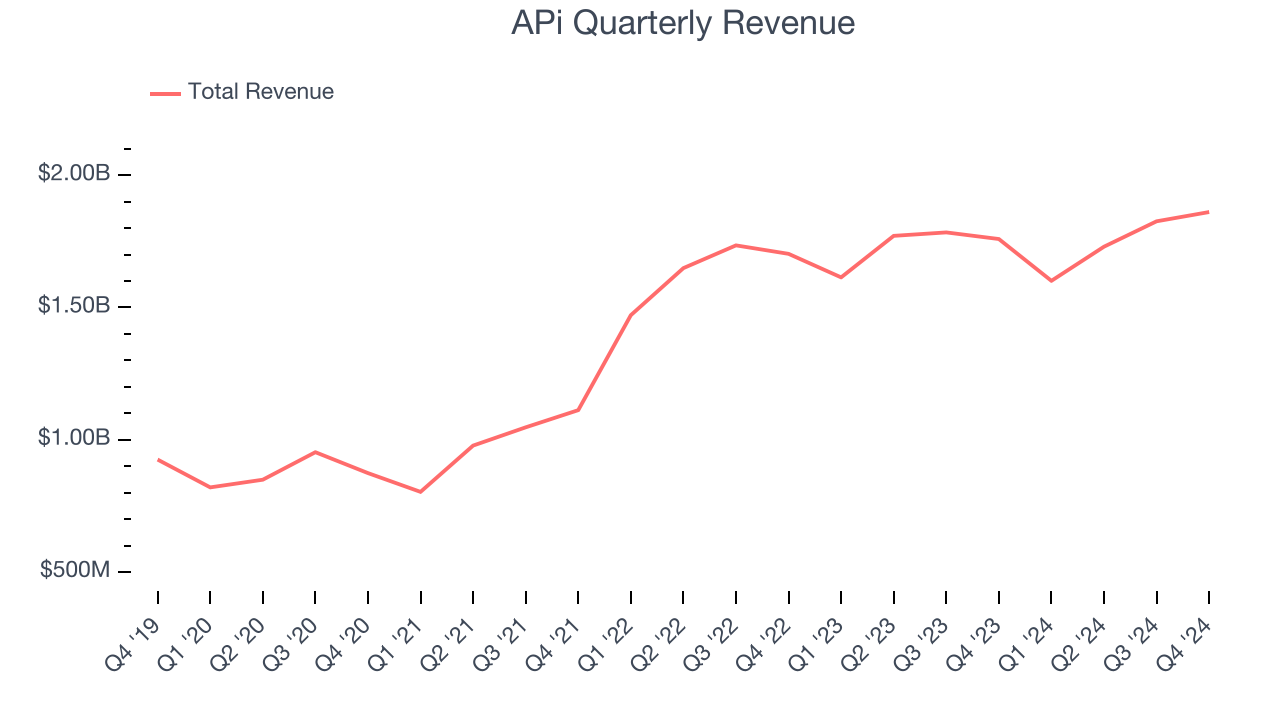
Long-term growth is the most important, but within industrials, a half-decade historical view may miss new industry trends or demand cycles. APi’s recent history shows its demand slowed significantly as its annualized revenue growth of 3.4% over the last two years is well below its five-year trend. 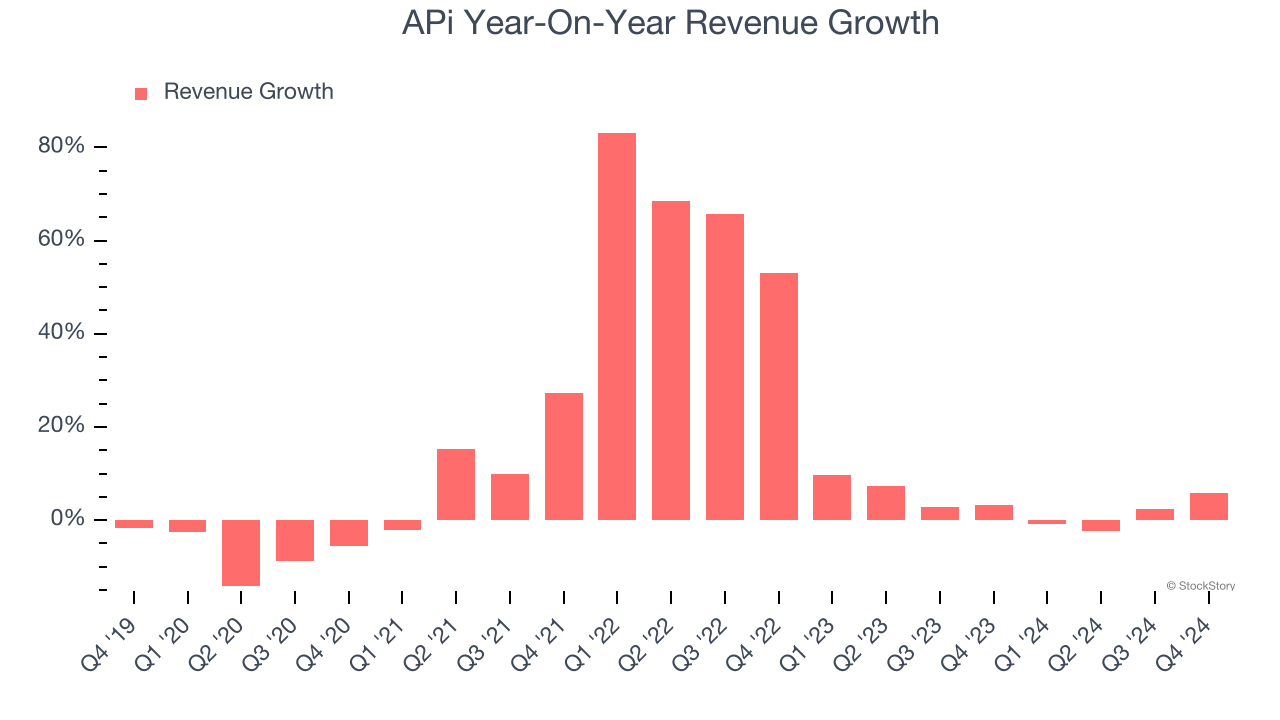
APi also reports organic revenue, which strips out one-time events like acquisitions and currency fluctuations that don’t accurately reflect its fundamentals. Over the last two years, APi’s organic revenue averaged 2.4% year-on-year growth. Because this number aligns with its normal revenue growth, we can see the company’s core operations (not acquisitions and divestitures) drove most of its results. 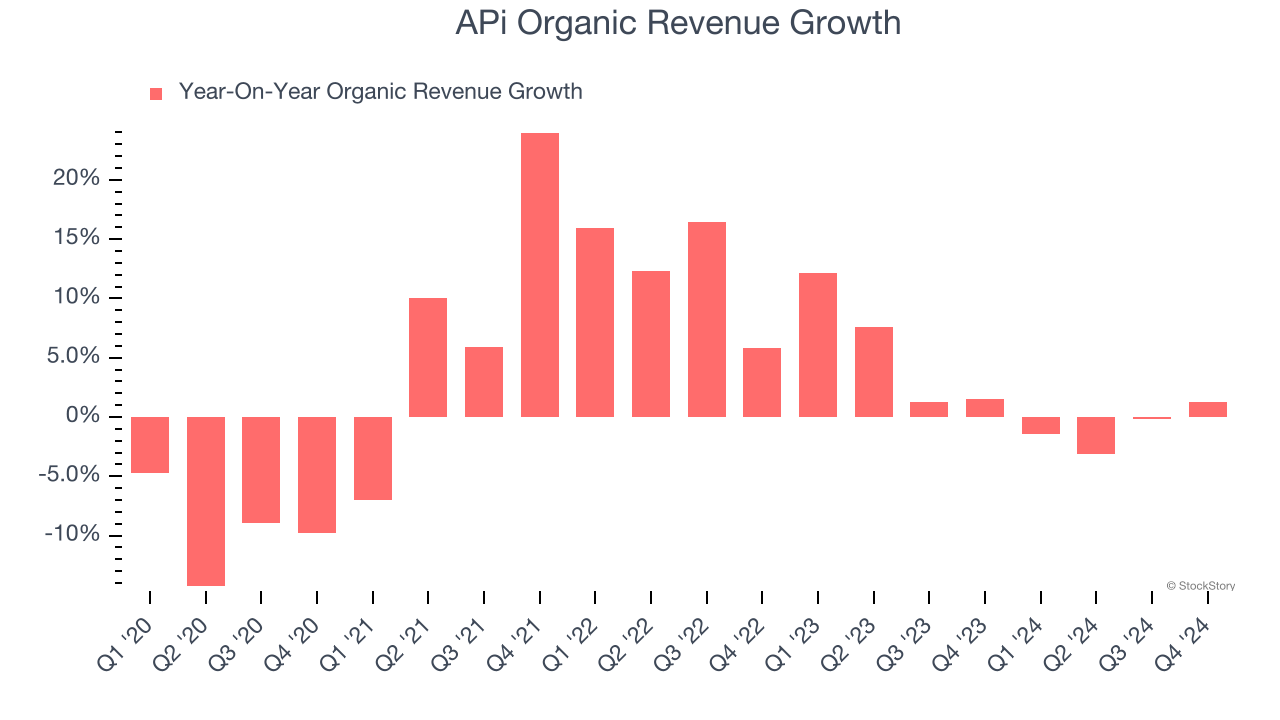
This quarter, APi reported year-on-year revenue growth of 5.8%, and its $1.86 billion of revenue exceeded Wall Street’s estimates by 1.2%. Company management is currently guiding for a 3.1% year-on-year increase in sales next quarter.
Looking further ahead, sell-side analysts expect revenue to grow 5.8% over the next 12 months. While this projection implies its newer products and services will catalyze better top-line performance, it is still below the sector average. At least the company is tracking well in other measures of financial health.
Today’s young investors won’t have read the timeless lessons in Gorilla Game: Picking Winners In High Technology because it was written more than 20 years ago when Microsoft and Apple were first establishing their supremacy. But if we apply the same principles, then enterprise software stocks leveraging their own generative AI capabilities may well be the Gorillas of the future. So, in that spirit, we are excited to present our Special Free Report on a profitable, fast-growing enterprise software stock that is already riding the automation wave and looking to catch the generative AI next.
Operating Margin
APi was profitable over the last five years but held back by its large cost base. Its average operating margin of 3.5% was weak for an industrials business. This result isn’t too surprising given its low gross margin as a starting point.
On the plus side, APi’s operating margin rose by 11.6 percentage points over the last five years, as its sales growth gave it immense operating leverage.
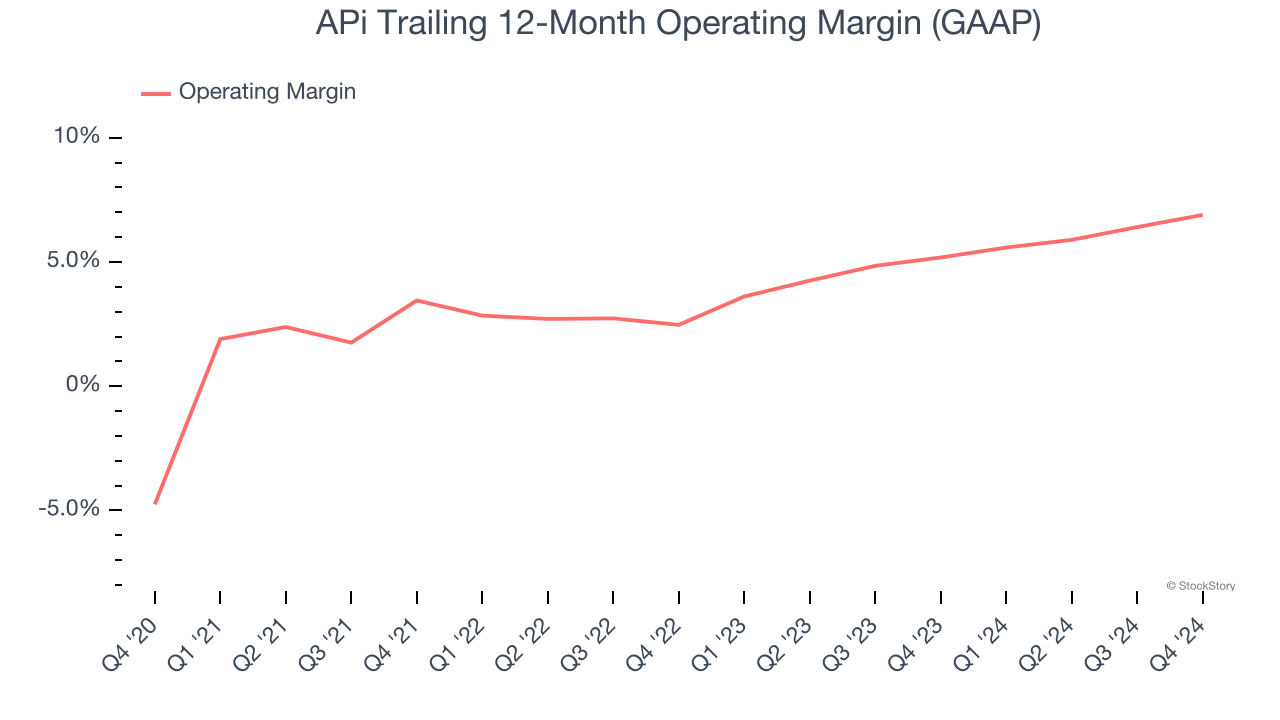
This quarter, APi generated an operating profit margin of 6.2%, up 2 percentage points year on year. Since its gross margin expanded more than its operating margin, we can infer that leverage on its cost of sales was the primary driver behind the recently higher efficiency.
Earnings Per Share
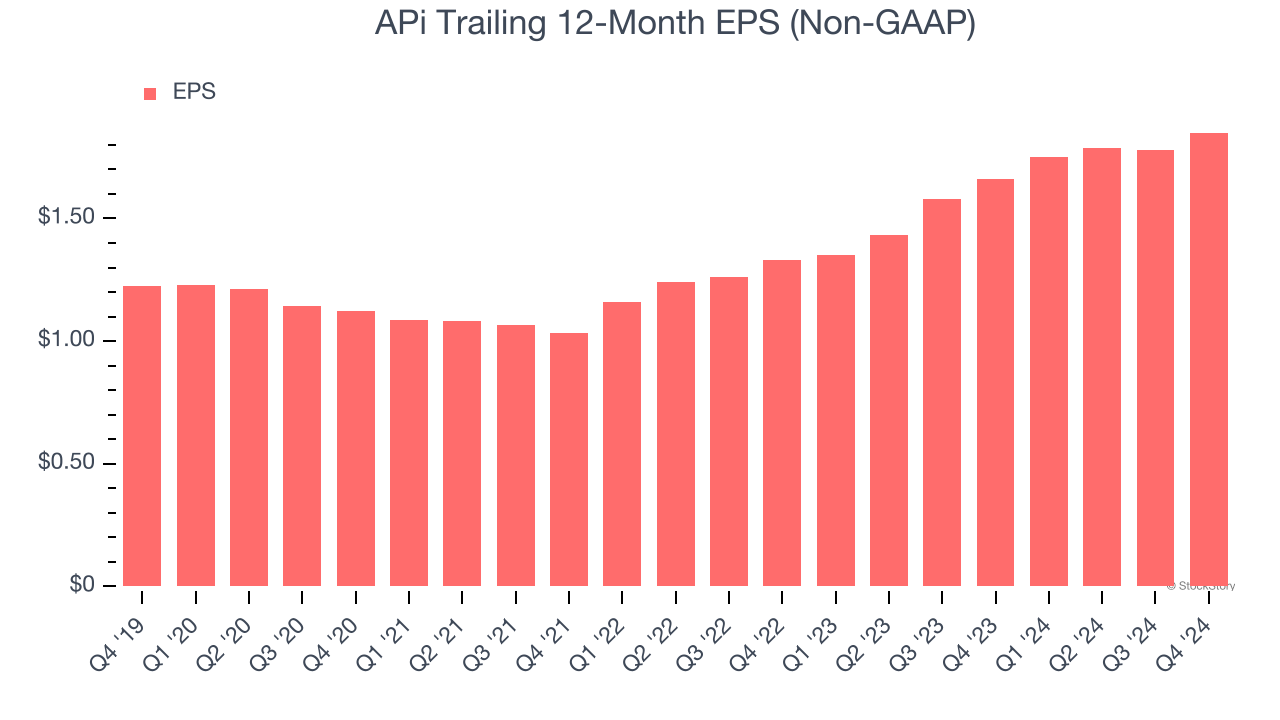
We track the long-term change in earnings per share (EPS) for the same reason as long-term revenue growth. Compared to revenue, however, EPS highlights whether a company’s growth is profitable.
APi’s EPS grew at a decent 8.6% compounded annual growth rate over the last five years. Despite its operating margin expansion during that time, this performance was lower than its 13% annualized revenue growth, telling us that non-fundamental factors such as interest and taxes affected its ultimate earnings.
We can take a deeper look into APi’s earnings quality to better understand the drivers of its performance. A five-year view shows APi has diluted its shareholders, growing its share count by 62.4%. This dilution overshadowed its increased operating efficiency and has led to lower per share earnings. Taxes and interest expenses can also affect EPS but don’t tell us as much about a company’s fundamentals. 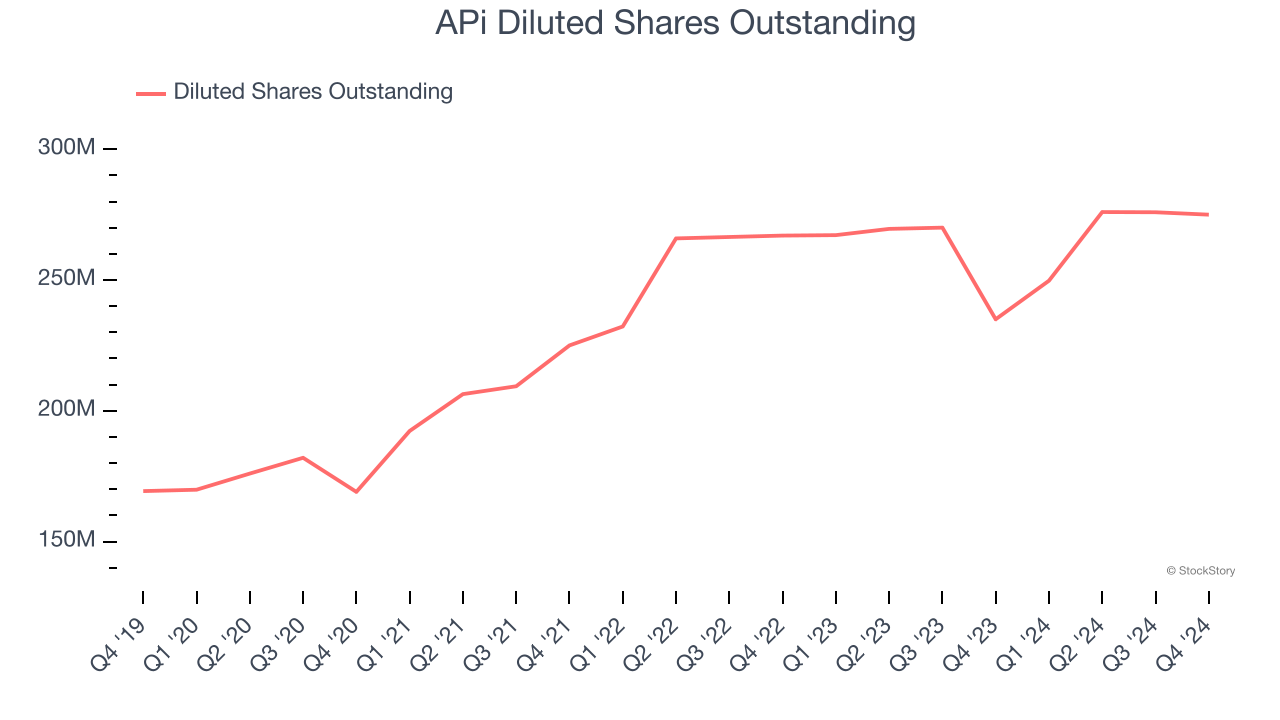
Like with revenue, we analyze EPS over a shorter period to see if we are missing a change in the business.
For APi, its two-year annual EPS growth of 17.9% was higher than its five-year trend. This acceleration made it one of the faster-growing industrials companies in recent history.
In Q4, APi reported EPS at $0.51, up from $0.44 in the same quarter last year. This print beat analysts’ estimates by 2.6%. Over the next 12 months, Wall Street expects APi’s full-year EPS of $1.85 to grow 11.4%.
Key Takeaways from APi’s Q4 Results
It was good to see APi narrowly top analysts’ revenue expectations this quarter due to slightly better organic revenue growth than Wall Street’s estimates. On the other hand, its revenue and EBITDA guidance for next quarter fell short of Wall Street’s estimates. Overall, this quarter was mixed. The stock traded up 2.2% to $41 immediately after reporting.
So do we think APi is an attractive buy at the current price? We think that the latest quarter is only one piece of the longer-term business quality puzzle. Quality, when combined with valuation, can help determine if the stock is a buy. We cover that in our actionable full research report which you can read here, it’s free.


