


Logistics solutions provider Hub Group (NASDAQ: HUBG) reported Q3 CY2025 results beating Wall Street’s revenue expectations, but sales fell by 5.3% year on year to $934.5 million. On the other hand, the company’s full-year revenue guidance of $3.65 billion at the midpoint came in 0.7% below analysts’ estimates. Its GAAP profit of $0.47 per share was 2.8% below analysts’ consensus estimates.
Is now the time to buy Hub Group? Find out by accessing our full research report, it’s free for active Edge members.
Hub Group (HUBG) Q3 CY2025 Highlights:
- Revenue: $934.5 million vs analyst estimates of $927.9 million (5.3% year-on-year decline, 0.7% beat)
- EPS (GAAP): $0.47 vs analyst expectations of $0.48 (2.8% miss)
- Adjusted EBITDA: $87.78 million vs analyst estimates of $81.54 million (9.4% margin, 7.7% beat)
- The company dropped its revenue guidance for the full year to $3.65 billion at the midpoint from $3.7 billion, a 1.4% decrease
- EPS (GAAP) guidance for the full year is $1.85 at the midpoint, beating analyst estimates by 1.8%
- Operating Margin: 4.2%, in line with the same quarter last year
- Free Cash Flow Margin: 2.1%, down from 3.6% in the same quarter last year
- Market Capitalization: $2.19 billion
“During the third quarter, Hub Group continued to navigate softer demand across freight markets. Intermodal profitability and revenue per load increased sequentially and from prior year. The Logistics operating margin also improved, and Hub Group started onboarding recent Final Mile awards. Our continuous improvement approach to expense management helped offset the impact of lower revenue. The recent addition of Marten Intermodal accelerates the momentum of our refrigerated intermodal business, and our strong balance sheet and free cash flow generation provide significant capital flexibility. We remain focused on serving customers and realizing the intermodal growth potential for Hub Group in collaboration with our rail partners Union Pacific and Norfolk Southern. Hub Group is well positioned to deliver accelerating growth and further improvement in margin performance,” said Phil Yeager, Hub Group’s President, Chief Executive Officer and Vice Chairman.
Company Overview
Started with $10,000, Hub Group (NASDAQ: HUBG) is a provider of intermodal, truck brokerage, and logistics services, facilitating transportation solutions for businesses worldwide.
Revenue Growth
A company’s long-term sales performance is one signal of its overall quality. Any business can put up a good quarter or two, but many enduring ones grow for years. Regrettably, Hub Group’s sales grew at a sluggish 1.6% compounded annual growth rate over the last five years. This was below our standards and is a tough starting point for our analysis.
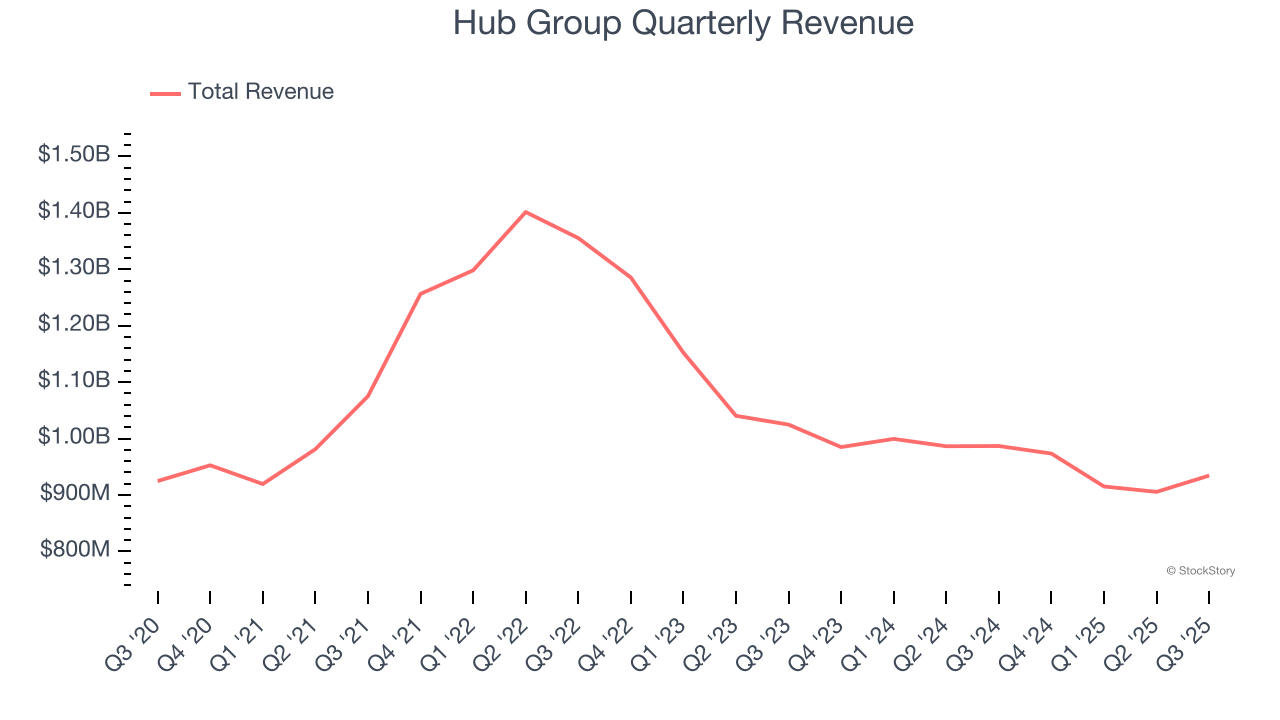
Long-term growth is the most important, but within industrials, a half-decade historical view may miss new industry trends or demand cycles. Hub Group’s performance shows it grew in the past but relinquished its gains over the last two years, as its revenue fell by 9% annually. Hub Group isn’t alone in its struggles as the Air Freight and Logistics industry experienced a cyclical downturn, with many similar businesses observing lower sales at this time. 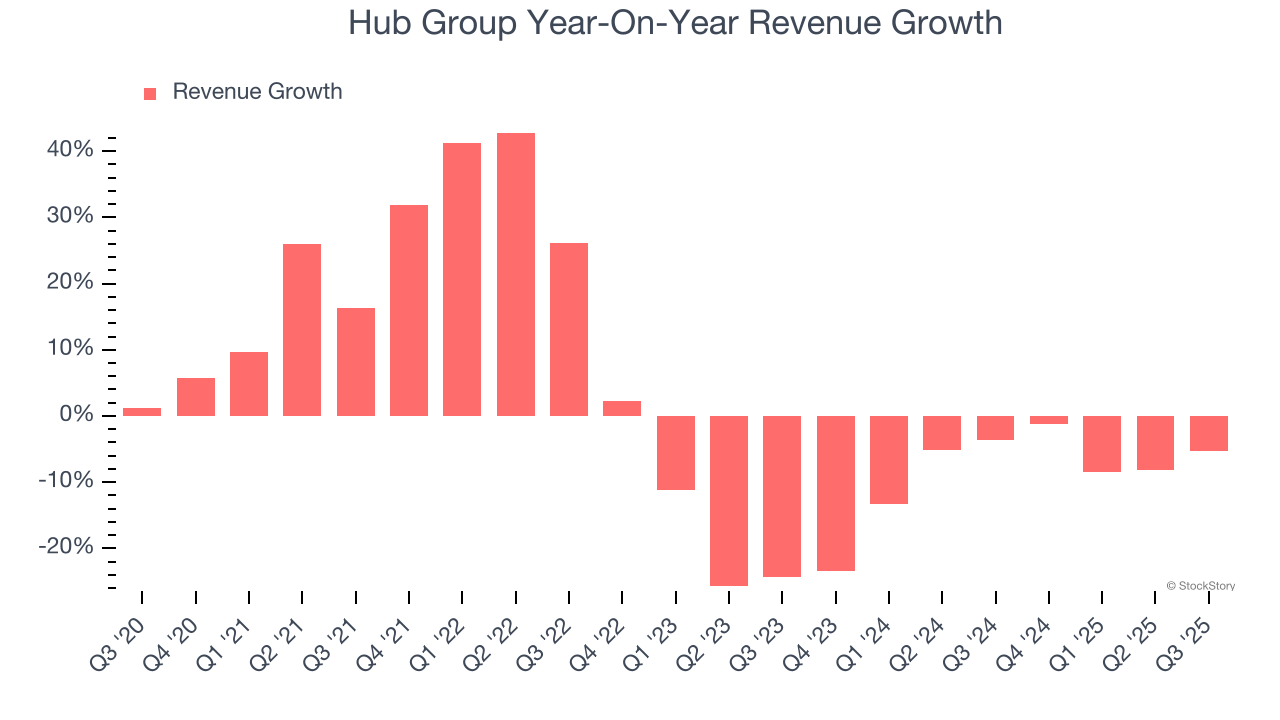
This quarter, Hub Group’s revenue fell by 5.3% year on year to $934.5 million but beat Wall Street’s estimates by 0.7%.
Looking ahead, sell-side analysts expect revenue to remain flat over the next 12 months. While this projection implies its newer products and services will catalyze better top-line performance, it is still below the sector average.
Today’s young investors won’t have read the timeless lessons in Gorilla Game: Picking Winners In High Technology because it was written more than 20 years ago when Microsoft and Apple were first establishing their supremacy. But if we apply the same principles, then enterprise software stocks leveraging their own generative AI capabilities may well be the Gorillas of the future. So, in that spirit, we are excited to present our Special Free Report on a profitable, fast-growing enterprise software stock that is already riding the automation wave and looking to catch the generative AI next.
Operating Margin
Operating margin is a key measure of profitability. Think of it as net income - the bottom line - excluding the impact of taxes and interest on debt, which are less connected to business fundamentals.
Hub Group’s operating margin might fluctuated slightly over the last 12 months but has generally stayed the same, averaging 5.6% over the last five years. This profitability was paltry for an industrials business and caused by its suboptimal cost structureand low gross margin.
Looking at the trend in its profitability, Hub Group’s operating margin might fluctuated slightly but has generally stayed the same over the last five years. This raises questions about the company’s expense base because its revenue growth should have given it leverage on its fixed costs, resulting in better economies of scale and profitability. Hub Group’s performance was poor, but we noticed this is a broad theme as many similar Air Freight and Logistics companies saw their margins fall (along with revenue, as mentioned above) because the cycle turned in the wrong direction.
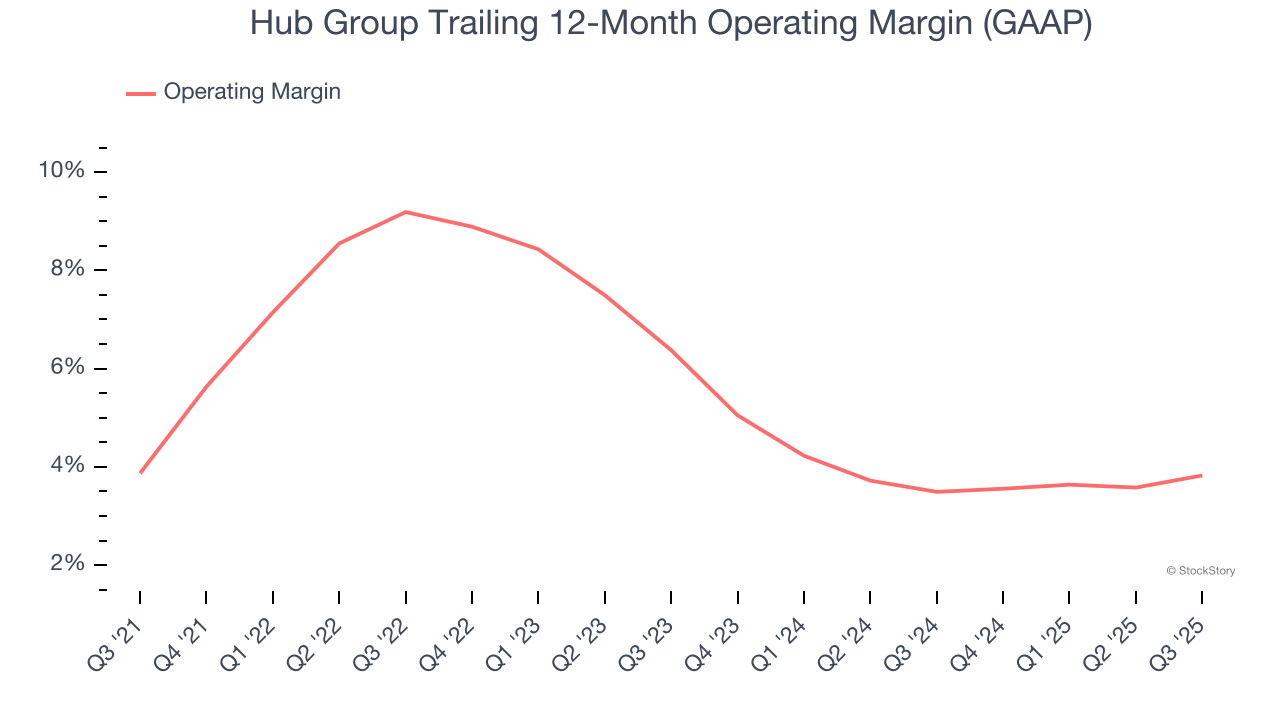
In Q3, Hub Group generated an operating margin profit margin of 4.2%, in line with the same quarter last year. This indicates the company’s cost structure has recently been stable.
Earnings Per Share
We track the long-term change in earnings per share (EPS) for the same reason as long-term revenue growth. Compared to revenue, however, EPS highlights whether a company’s growth is profitable.
Hub Group’s EPS grew at an unimpressive 8% compounded annual growth rate over the last five years. This performance was better than its flat revenue but doesn’t tell us much about its business quality because its operating margin didn’t improve.
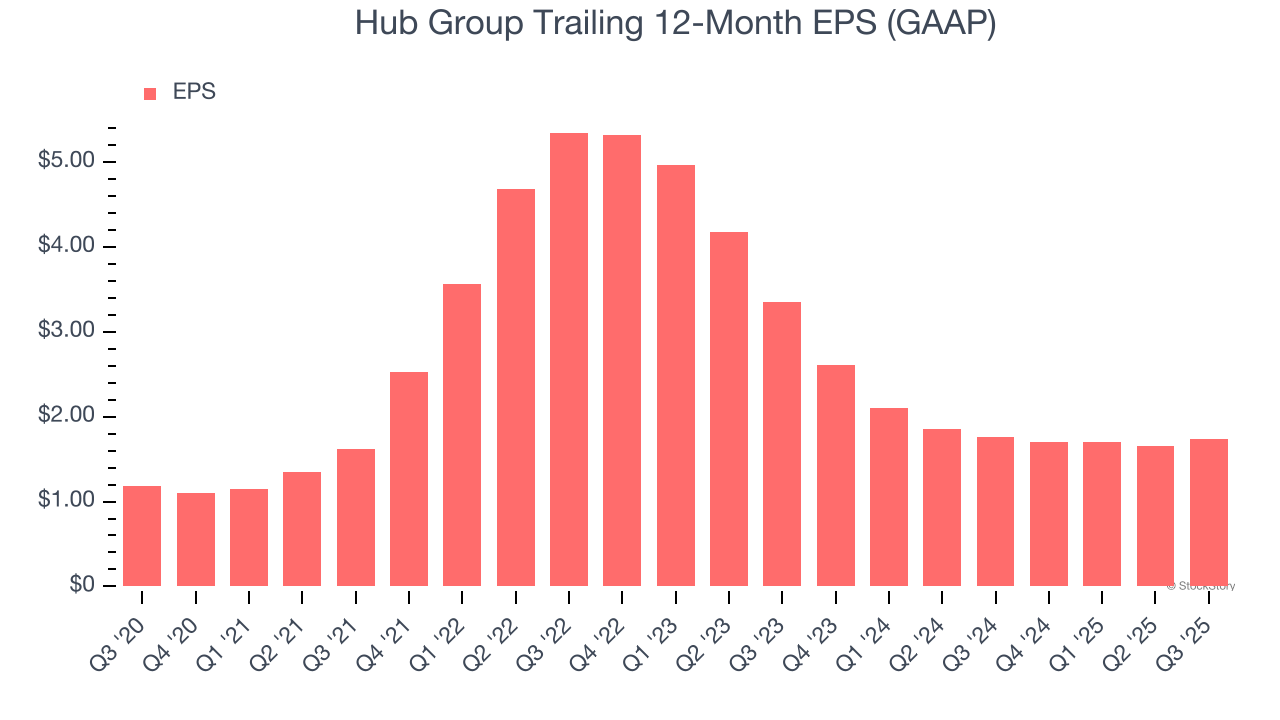
Diving into the nuances of Hub Group’s earnings can give us a better understanding of its performance. A five-year view shows that Hub Group has repurchased its stock, shrinking its share count by 10.2%. This tells us its EPS outperformed its revenue not because of increased operational efficiency but financial engineering, as buybacks boost per share earnings. 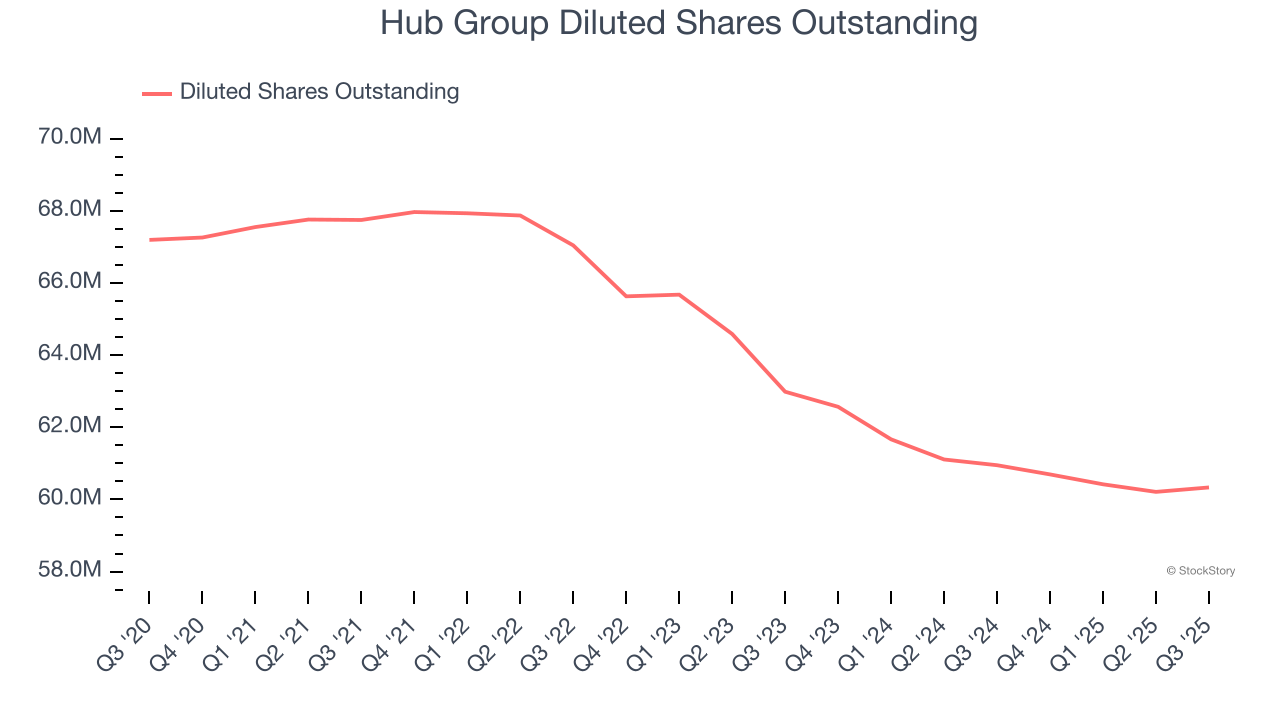
Like with revenue, we analyze EPS over a more recent period because it can provide insight into an emerging theme or development for the business.
For Hub Group, its two-year annual EPS declines of 28.1% show it’s continued to underperform. These results were bad no matter how you slice the data.
In Q3, Hub Group reported EPS of $0.47, up from $0.39 in the same quarter last year. Despite growing year on year, this print missed analysts’ estimates. Over the next 12 months, Wall Street expects Hub Group’s full-year EPS of $1.73 to grow 18.5%.
Key Takeaways from Hub Group’s Q3 Results
We were impressed by how significantly Hub Group blew past analysts’ EBITDA expectations this quarter. We were also glad its full-year EPS guidance exceeded Wall Street’s estimates. On the other hand, its EPS missed and its full-year revenue guidance fell slightly short. Overall, this print was mixed but still had some key positives. The stock remained flat at $35.46 immediately following the results.
Is Hub Group an attractive investment opportunity right now? What happened in the latest quarter matters, but not as much as longer-term business quality and valuation, when deciding whether to invest in this stock. We cover that in our actionable full research report which you can read here, it’s free for active Edge members.


