


Telecommunications and media company Comcast (NASDAQ: CMCSA) reported Q3 CY2025 results exceeding the market’s revenue expectations, but sales fell by 2.7% year on year to $31.2 billion. Its non-GAAP profit of $1.12 per share was 1.7% above analysts’ consensus estimates.
Is now the time to buy Comcast? Find out by accessing our full research report, it’s free for active Edge members.
Comcast (CMCSA) Q3 CY2025 Highlights:
- Revenue: $31.2 billion vs analyst estimates of $30.7 billion (2.7% year-on-year decline, 1.6% beat)
- Adjusted EPS: $1.12 vs analyst estimates of $1.10 (1.7% beat)
- Adjusted EBITDA: $9.67 billion vs analyst estimates of $9.65 billion (31% margin, in line)
- Operating Margin: 17.7%, in line with the same quarter last year
- Free Cash Flow Margin: 15.9%, up from 10.6% in the same quarter last year
- Domestic Broadband Customers: 31.44 million, down 545,000 year on year
- Market Capitalization: $105.3 billion
“We're making steady progress as we reposition the company for long-term, sustained growth," said Brian L. Roberts, Chairman and Chief Executive Officer of Comcast Corporation.
Company Overview
Formerly known as American Cable Systems, Comcast (NASDAQ: CMCSA) is a multinational telecommunications company offering a wide range of services.
Revenue Growth
Reviewing a company’s long-term sales performance reveals insights into its quality. Even a bad business can shine for one or two quarters, but a top-tier one grows for years. Over the last five years, Comcast grew its sales at a sluggish 3.4% compounded annual growth rate. This fell short of our benchmark for the consumer discretionary sector and is a poor baseline for our analysis.
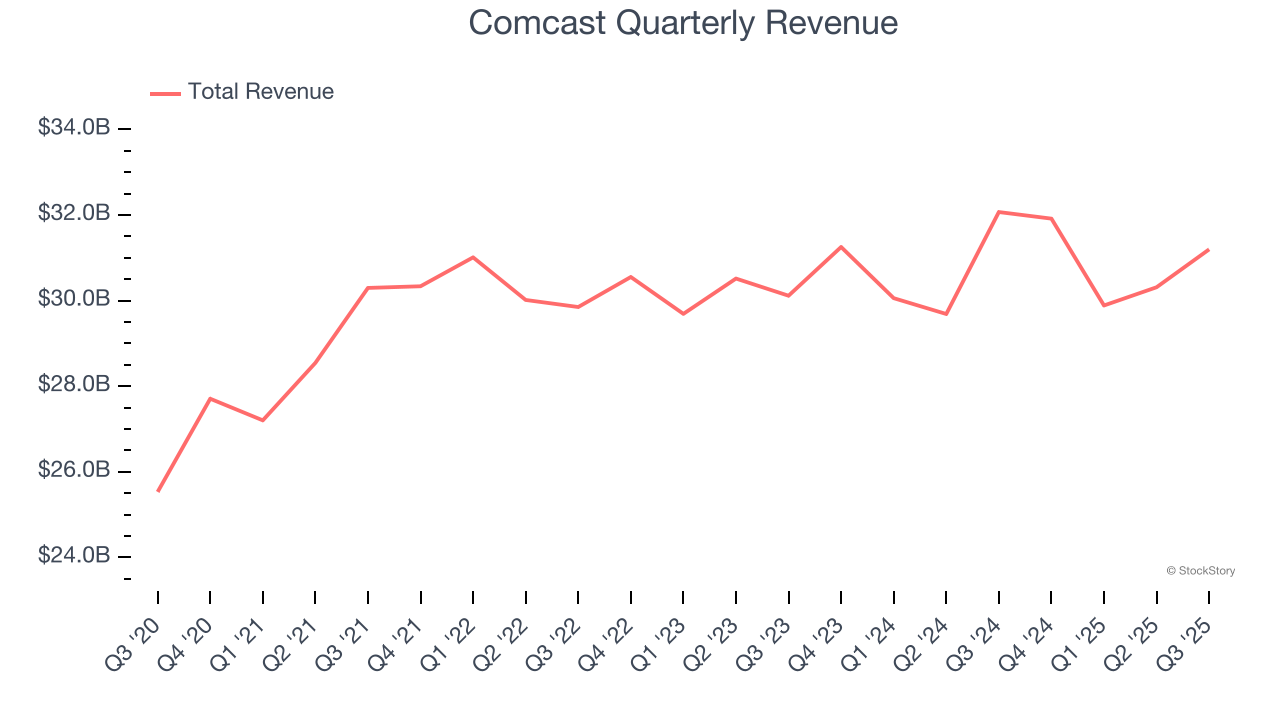
Long-term growth is the most important, but within consumer discretionary, product cycles are short and revenue can be hit-driven due to rapidly changing trends and consumer preferences. Comcast’s recent performance shows its demand has slowed as its annualized revenue growth of 1% over the last two years was below its five-year trend. 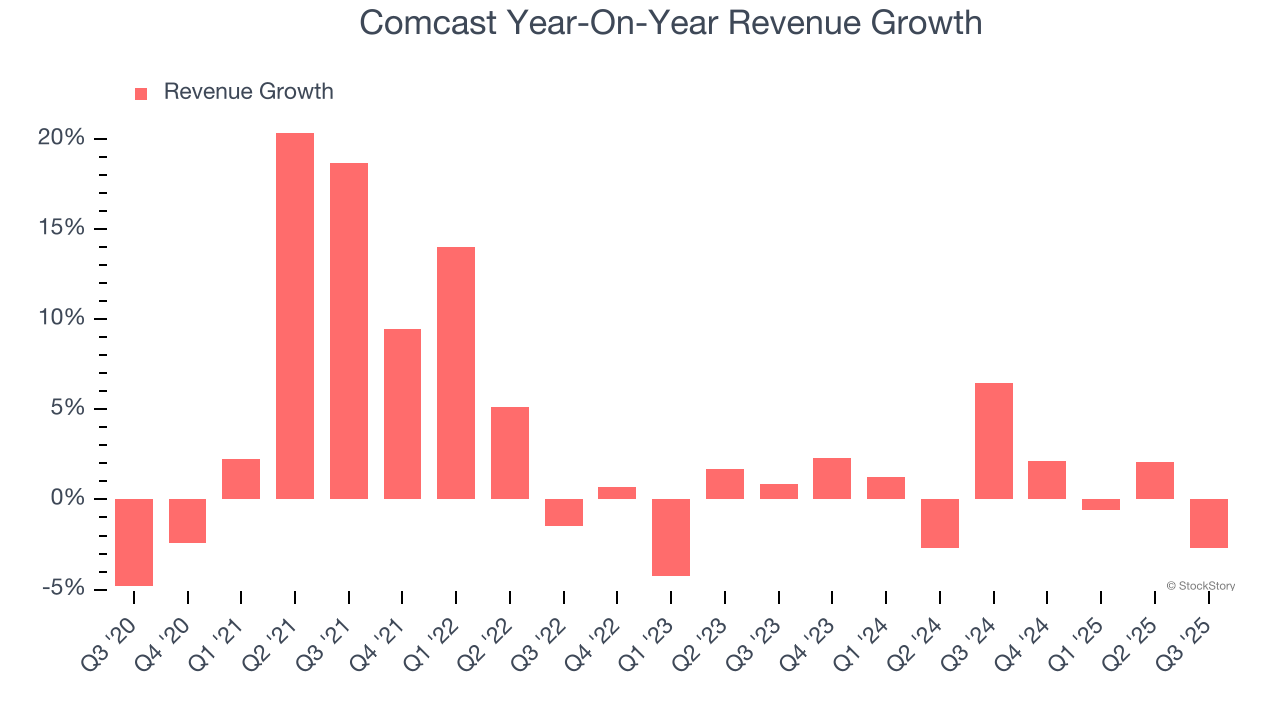
Comcast also discloses its number of domestic broadband customers and domestic video customers, which clocked in at 31.44 million and 11.52 million in the latest quarter. Over the last two years, Comcast’s domestic broadband customers averaged 1.1% year-on-year declines while its domestic video customers averaged 11.5% year-on-year declines. 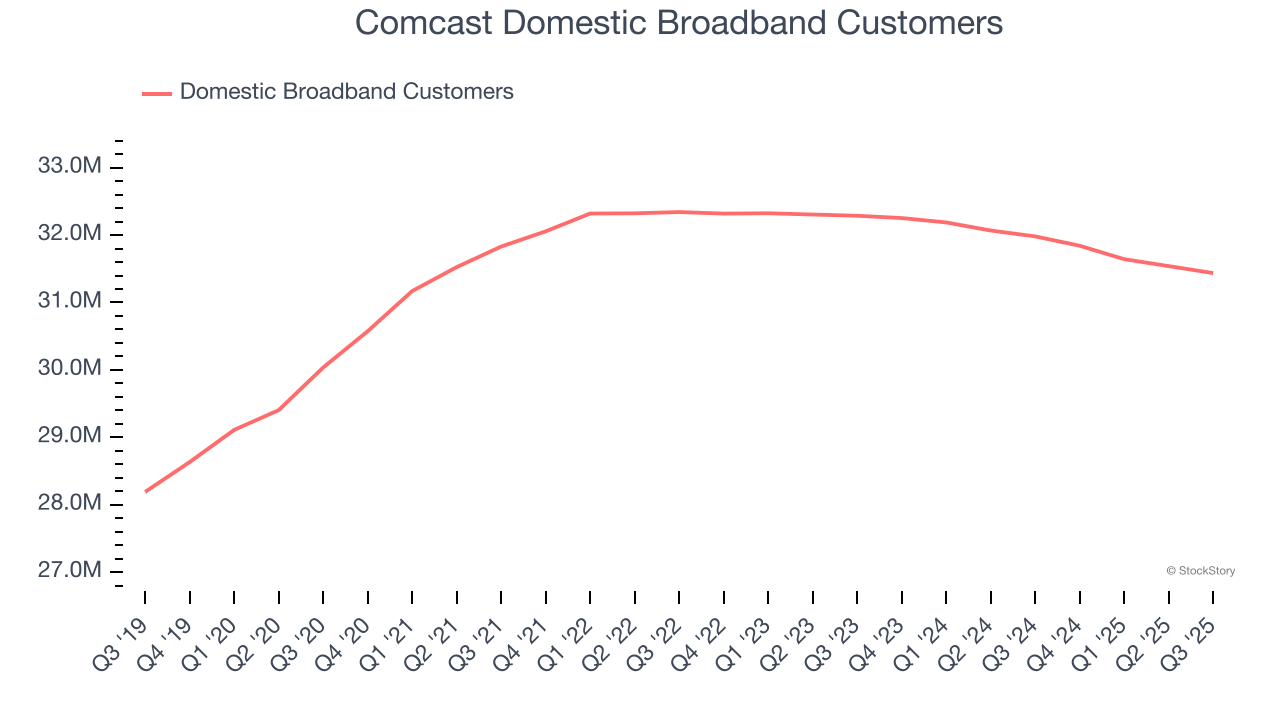
This quarter, Comcast’s revenue fell by 2.7% year on year to $31.2 billion but beat Wall Street’s estimates by 1.6%.
Looking ahead, sell-side analysts expect revenue to grow 3.2% over the next 12 months. While this projection suggests its newer products and services will spur better top-line performance, it is still below the sector average.
Today’s young investors won’t have read the timeless lessons in Gorilla Game: Picking Winners In High Technology because it was written more than 20 years ago when Microsoft and Apple were first establishing their supremacy. But if we apply the same principles, then enterprise software stocks leveraging their own generative AI capabilities may well be the Gorillas of the future. So, in that spirit, we are excited to present our Special Free Report on a profitable, fast-growing enterprise software stock that is already riding the automation wave and looking to catch the generative AI next.
Operating Margin
Operating margin is an important measure of profitability as it shows the portion of revenue left after accounting for all core expenses – everything from the cost of goods sold to advertising and wages. It’s also useful for comparing profitability across companies with different levels of debt and tax rates because it excludes interest and taxes.
Comcast’s operating margin might fluctuated slightly over the last 12 months but has remained more or less the same, averaging 18.2% over the last two years. This profitability was top-notch for a consumer discretionary business, showing it’s an well-run company with an efficient cost structure.
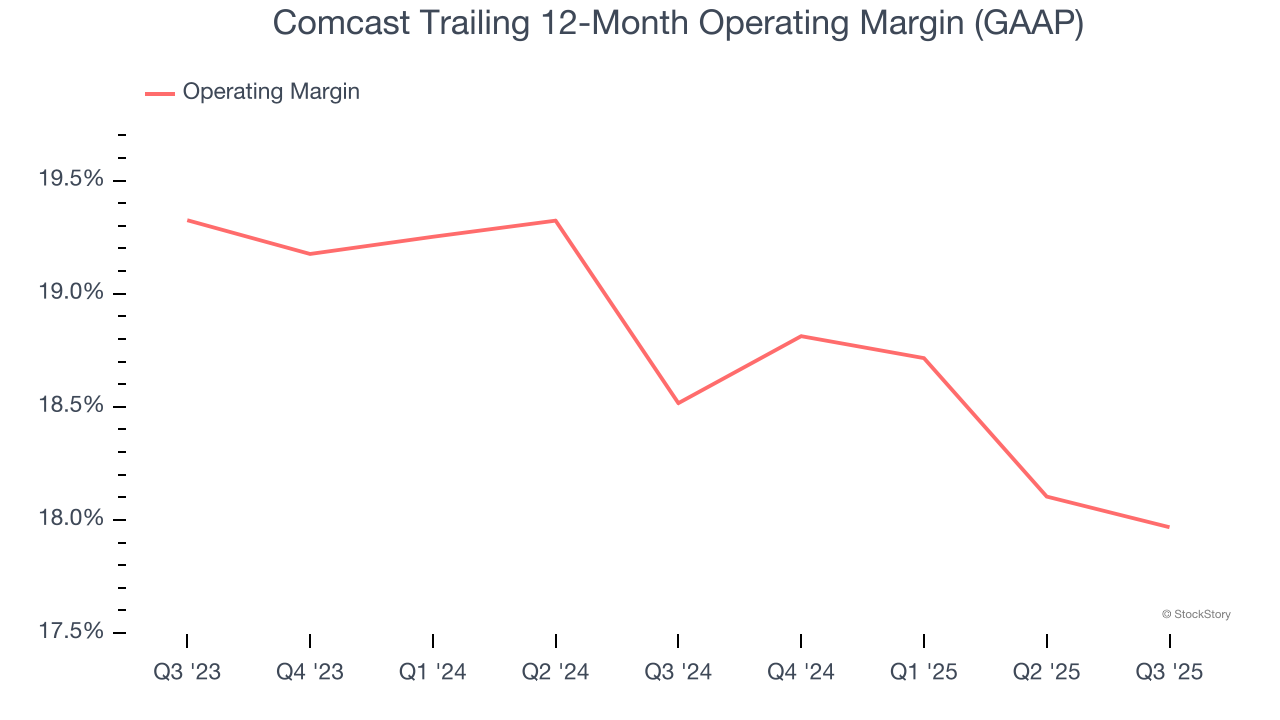
In Q3, Comcast generated an operating margin profit margin of 17.7%, in line with the same quarter last year. This indicates the company’s overall cost structure has been relatively stable.
Earnings Per Share
Revenue trends explain a company’s historical growth, but the long-term change in earnings per share (EPS) points to the profitability of that growth – for example, a company could inflate its sales through excessive spending on advertising and promotions.
Comcast’s EPS grew at an unimpressive 9.2% compounded annual growth rate over the last five years. On the bright side, this performance was better than its 3.4% annualized revenue growth and tells us the company became more profitable on a per-share basis as it expanded.
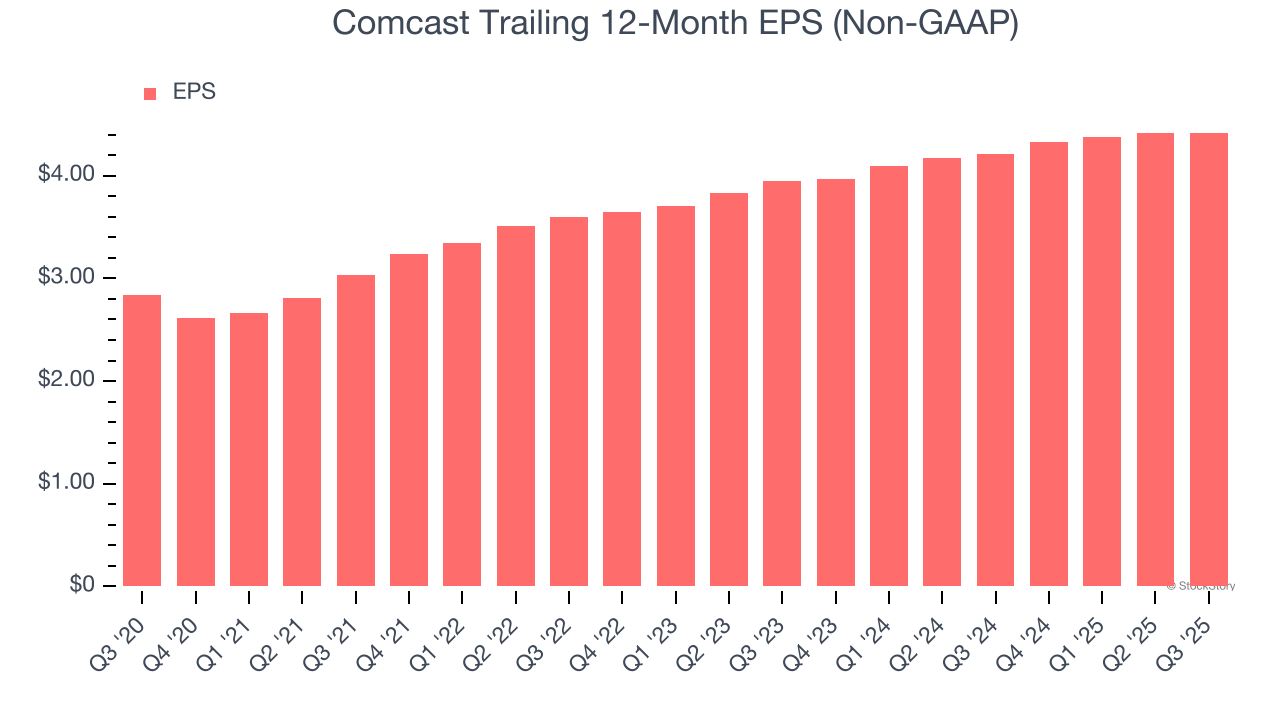
In Q3, Comcast reported adjusted EPS of $1.12, in line with the same quarter last year. This print beat analysts’ estimates by 1.7%. Over the next 12 months, Wall Street expects Comcast’s full-year EPS of $4.42 to shrink by 1.1%.
Key Takeaways from Comcast’s Q3 Results
It was encouraging to see Comcast beat analysts’ revenue and EPS expectations this quarter. On the other hand, the business lost 104,000 broadband customers, marking the fourth straight quarter of losses. Zooming out, we think this was a mixed quarter. The stock traded up 1.4% to $28.91 immediately after reporting.
So do we think Comcast is an attractive buy at the current price? When making that decision, it’s important to consider its valuation, business qualities, as well as what has happened in the latest quarter. We cover that in our actionable full research report which you can read here, it’s free for active Edge members.


