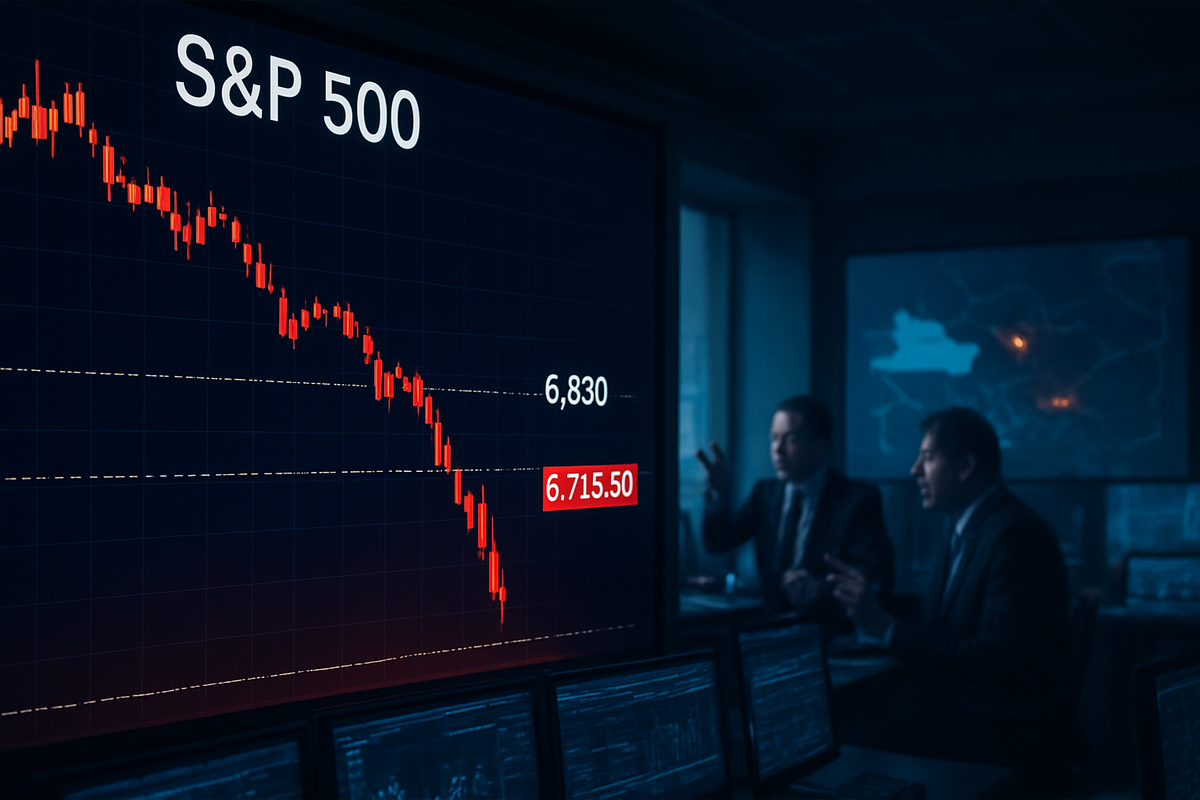
The S&P 500 Index (^SPX:CBOE) faced a brutal start to the trading week on March 2, 2026, as a "perfect storm" of geopolitical escalations and cooling economic data sent shockwaves through the equity markets. After a gap-down opening that wiped out months of gains in minutes, the benchmark index is currently fighting to hold critical short-term support at 6,775.50. The collapse through the 100-day moving average (DMA) near 6,830 has signaled a shift in market regime from "buy the dip" to "sell the rip," leaving active traders scrambling to re-evaluate their exposure in an increasingly volatile environment.
The bearish momentum intensified during early Monday trading following the release of the February ISM Manufacturing report, which showed a deeper-than-expected contraction in industrial activity. This macro weakness, coupled with a spike in the CBOE Volatility Index (^VIX:CBOE), has forced the SPDR S&P 500 ETF Trust (SPY:ARCX) to trade at its lowest levels since late 2025. Technical analysts are now closely watching the 6,775.50 level; a decisive close below this mark could open the trapdoor to the 200-day moving average, located significantly lower, as the market grapples with a sudden evaporation of liquidity.
Technical Breakdown: The 100-Day Support Failure
The breach of the 100-day moving average at 6,830 marks a significant psychological and technical turning point for the S&P 500. For much of the 2025 bull run, this moving average served as a reliable floor, attracting institutional "dip-buyers" whenever the market cooled. However, the sharp opening drop on March 2 bypassed this level entirely through a price gap, suggesting that institutional conviction has buckled under the weight of current macro pressures. The current test of 6,775.50 represents a minor support level formed during the mid-December consolidation phase, but its strength is being severely tested by heavy sell volume in the morning session.
The timeline leading to this morning's rout began in late February when reports of military strikes in the Middle East led to the reported closure of the Strait of Hormuz. This "Iran Shock" sent crude oil prices soaring, reigniting fears of stagflation just as the Federal Reserve was expected to finalize its rate-cutting cycle. By the time the opening bell rang on Monday, the technical damage was already visible in the pre-market futures, where the E-mini S&P 500 contracts showed a massive "breakaway gap" that traditional technical models view as a harbinger of continued downside momentum.
Sector Divergence: Winners and Losers in a Bearish Turn
The primary victims of this morning's sell-off are the high-flying technology giants that have dominated the index's weighting. NVIDIA Corporation (NVDA:NASDAQ) and Apple Inc. (AAPL:NASDAQ) both saw significant downward pressure as investors rotated out of high-multiple "AI-growth" stocks and into cash. Microsoft Corporation (MSFT:NASDAQ) also struggled, breaking below its own key moving averages as the market began to question whether the massive capital expenditures required for AI infrastructure can be sustained in a higher-inflation, lower-growth "stagflationary" environment.
Conversely, the energy sector has emerged as a lone bastion of green in a sea of red. Exxon Mobil Corporation (XOM:NYSE) surged over 4% in early trading as Brent crude prices climbed toward seven-month highs following the disruptions in the Strait of Hormuz. Defense contractors and "safe-haven" assets are also seeing modest inflows. However, the broader market pain is being felt most acutely in the consumer discretionary sector, where companies like Amazon.com Inc. (AMZN:NASDAQ) are facing the double-whammy of rising transport costs from oil and the continued impact of the 2025 tariff regime on imported goods.
Wider Significance: A Confluence of Crisis and Transition
The current market turmoil is more than just a technical correction; it reflects a broader shift in the global economic and geopolitical order. The "Iran Shock" has introduced a level of energy price volatility not seen since the early 2020s, complicating the Federal Reserve's path forward. With Jerome Powell’s term as Fed Chair set to expire in May 2026, the nomination of Kevin Warsh has introduced a layer of leadership uncertainty. Traders are questioning whether a Warsh-led Fed will prioritize inflation-fighting over market stability, especially if the current downturn accelerates.
Furthermore, the breakdown in the S&P 500 mirrors a "valuation reckoning" that many analysts warned was overdue. With the index entering 2026 at a forward P/E ratio of 22x, there was little room for error. The expiration of the New START Treaty in February 2026 without a successor has added a "geopolitical risk premium" that is now being priced into stocks for the first time in decades. Historically, when the S&P 500 breaks its 100-day moving average with this much force, it often takes several weeks of consolidation or a move to the 200-day average before a sustainable bottom is formed.
The Road Ahead: Support Levels and Strategic Pivots
Looking forward, the immediate focus for traders remains the 6,775.50 support level. If this level fails to hold by the closing bell on March 2, technical analysts point to the 6,650 level as the next logical zone for a potential bounce. Investors should also prepare for the March 11 release of the February CPI data, which will be the ultimate arbiter of whether the Fed can afford to cut rates at the March 17-18 FOMC meeting. A hot inflation print could force the Fed to remain hawkish despite the market's slide, a scenario that would likely lead to further technical deterioration.
In the long term, the market may require a "strategic pivot" away from growth-at-any-cost tech and toward value and cyclical stocks that can weather a higher-inflation environment. For active traders, the high-volatility environment provides opportunities in short-dated options and inverse ETFs, but for long-term investors, the current drop represents a test of patience. The potential for a "relief rally" remains if diplomatic efforts in the Middle East show progress, but until the S&P 500 can reclaim the 6,830 level (the old 100-day support now turned resistance), the path of least resistance appears to be lower.
Summary and Market Outlook
The S&P 500's break below the 6,830 mark and its current test of 6,775.50 support signify a major "risk-off" event for early 2026. The combination of the "Iran Shock," a cooling domestic manufacturing sector, and leadership transitions at the Federal Reserve has created a bearish sentiment that technical indicators suggest could persist through the end of the quarter. While the long-term outlook for the S&P 500 remains optimistic according to many Wall Street year-end targets of 7,500+, the short-term reality is one of correction and consolidation.
Investors should remain vigilant, watching for a daily close above or below the current support levels to determine their next move. The primary takeaways from today's session are the fragility of high-valuation tech in the face of energy shocks and the critical importance of the 100-day moving average as a trend filter. In the coming months, the focus will shift from "AI hype" to "macro reality," and the market’s ability to find a floor will depend heavily on the Fed’s March decision and the resolution of the brewing energy crisis in the Middle East.
This content is intended for informational purposes only and is not financial advice.